


POEM: POpulation Epidemiological Model for anti-epidemic measures efficiency prognosis in the Russian Federation
- Authors: Popova A.Y.1, Ayupova A.F.2, Govorun V.M.2, Gorbacheva A.A.2, Ilina E.N.2, Kachalov V.N.2,3, Kozlov I.E.2, Klochkov K.A.2,3, Kutyrev V.V.4, Lukashev A.N.2,5, Manolov A.I.2, Maslova I.I.2, Samoilov A.E.2, Safronov V.A.4, Tsurkis V.I.2
-
Affiliations:
- Federal Service for Supervision of Consumer Rights Protection and Human Welfare
- Research Institute for Systems Biology and Medicine
- Moscow Institute of Physics and Technology, National Research University
- Russian Research Anti-Plague Institute “Microbe”
- Sechenov First Moscow State Medical University
- Issue: Vol 102, No 5 (2025)
- Pages: 515-529
- Section: ORIGINAL RESEARCHES
- URL: https://microbiol.crie.ru/jour/article/view/18945
- DOI: https://doi.org/10.36233/0372-9311-760
- EDN: https://elibrary.ru/DJJHPV
- ID: 18945

Cite item

Abstract
Introduction. The COVID-19 pandemic has revealed a whole complex of problems related to mathematical modeling of the epidemic process and assessing the effect of preventive and anti-epidemic measures in modern complex societies. Along with this, the accumulation of significant factual data has spurred the active development of agent-based models, in which each agent (a hypothetical person) has a unique set of characteristics and interaction methods determined based on real sociological and demographic data.
Aim and objectives. Development and demonstration of the capabilities of the epidemiological agent-based model POEM platform (POpulation Epidemiological Model).
Materials and methods. The POEM platform is developed based on the source code of one of the most widely used agent-based models worldwide, Covasim, taking into account the demographic and organizational-administrative conditions specific to the Russian Federation.
Results. Computational experiments have shown that due to individual variability in the dynamics of infection development and the specifics of disease registration, even mass events, while leading to an actual increase in the number of infected individuals, do not have a significant impact on the shape of the curve of registered disease incidence. It has been shown that intercity traffic flows at a level of 0.1% of the population per day have a minimal effect on the dynamics of the epidemic's development, while the effect of a 1% population outflow per day sharply reduces the effect of strict anti-epidemic measures implemented in only one particular city. Using the example of the Voronezh region, the transition from the Delta variant to Omicron in early 2022 was modeled, and a high degree of correlation was shown between the model dynamics and the actual ratio of virus variants observed.
Conclusion. The model is fully implemented within the Russian system on the server of the Research Institute for System Biology and Medicine of Rospotrebnadzor and can be used to conduct digital epidemiological experiments to predict the effectiveness of proposed anti-epidemic measures.
Full Text
Introduction
The COVID-19 pandemic has shown that socioeconomic factors are an objective constraint in implementing the necessary set of anti-epidemic measures. Different countries have chosen different approaches to preventing the spread of the new coronavirus infection, in all cases justifying the validity of the decisions being made. Against this backdrop, the need for computational epidemiological models became evident, which would allow for the most objective assessment of the potential effect of individual anti-epidemic measures and correlate it with the socio-economic losses from the epidemic. Thus, the COVID-19 pandemic served as a catalyst for the development of methods for computer modeling of epidemics.
Computational models for studying the spread of infectious diseases can be divided into two main types: compartmental and agent-based. Compartment models appeared almost 100 years ago and were actively used due to the speed and ease of calculations. In the basic compartmental model (SIR – Susceptible, Infected, Recovered), all individuals are identical and can only be in three states. Although modifications to the SIR model have been described for analyzing additional parameters, accounting for individual combinations of properties of the subjects within the population is practically non-existent. Agent-based models allow each virtual entity to be endowed with unique characteristics of any complexity. They are much more computationally expensive, but they allow for the creation of a digital environment that most accurately reproduces the conditions of the epidemic process's development [1].
The complexity of development has led to the widespread practice of using ready-made open-source agent models, which are then customized by the user to solve a range of specific tasks. Among the main computational approaches considered for creating artificial populations whose agents are humans, the FRED [2], AceMod and Covasim [3] platforms have gained the widest adoption in modeling respiratory infections.
The open-source platform Covasim stands out because it contains numerous built-in algorithms for modeling epidemic control measures and allows for modification of the software code to implement additional functionalities. It has been used to address a wide range of issues, such as determining the optimal testing strategy for asymptomatic carriers [4], modeling the circulation of different SARS-CoV-2 variants [5], the effect of lifting school closures [6] and the likelihood of a second wave [7] in the UK, developing pandemic control strategies [8, 9] and vaccination strategies [10] in Australia, and vaccination strategies in the USA [11] and Italy [12]. In most of these works, a model was used that was refined to take into account regional characteristics and specific tasks.
The aim of the study is to develop an agent-based epidemiological model POEM (Population Epidemiological Model) based on the Covasim platform for modeling epidemics, studying the influence of various factors on pathogen spread, as well as evaluating the effectiveness of anti-epidemic measures in an artificial population. The application of the developed computational tool was demonstrated in a series of digital experiments, comparing it with observed epidemiological patterns.
Materials and methods
The development was based on the open-source program Covasim, released under the Creative Commons Attribution-ShareAlike 4.0 license and available on the GitHub server (github.com/institutefordiseasemodeling/covasim). APOEM, like Covasim, is implemented in the programming languages Python and JavaScript.
Modeling two or more settlements and their interactions
The simulation of 2 or more settlements was implemented using parallel computing as follows: during the initialization phase, additional cells are created in each city for agents who may arrive in that city. Then each city is modeled in a separate computational thread. The main simulation includes three stages: adding agents who have arrived in the city, performing the main simulation step (one simulated day), and selecting agents who will leave the city in the next simulation step. For each displaced agent, the duration of their stay in another city is chosen based on a Poisson distribution with a mean value of 14 days (this parameter can be changed by the user). An agent who has temporarily moved from one settlement to another only has random interactions, but their number increases by an average of 3 times (the coefficient can be changed by the user). The graphical interface has been enhanced with the ability to define one or more transportation flows (agent movement between settlements). The user specifies the origin and destination, as well as the proportion of agents moving daily. The graphical interface also allows you to view simulation results for individual locations in different tabs or compare them on a single graph.
Modeling the conduct of mass gatherings
The simulation of mass gatherings is implemented as follows: the user inputs a table (through a graphical interface or by calling functions in Python) containing the date of each event, the number of participants and the number of such gatherings. To implement this module, a new contacts layer was added. This layer is dynamic, with contacts updated daily to simulate new events. An agent can only participate in one event per day.
In the first step, a list of people who will participate in mass events is randomly determined. Next, participants break into groups for separate meetings. For each group, contacts are randomly established so that each agent has an average of 9 connections, as literature suggests that even for large mass events, the average number of contacts lasting 15 minutes or more, during which the virus can be transmitted, is 9 [13]. The probability of infection transmission through contact at mass events is assumed to be the same as workplace contacts.
Functional extensions of the Covasim model implemented in the APOEM software platform
New variants of agent susceptibility distributions and their infectivity have been introduced. A variant has been implemented where agents have individual but identical values for susceptibility and infectivity for a given agent, with the aim of modeling the behavior of agents with high values for both indicators.
Accounting for the time delay between receiving a positive test result and the date the information is submitted to state control bodies has been added. Each agent is assigned a delay in receiving test results (a random number from a given distribution), which is added to the test date during the simulation.
To account for the socio-demographic characteristics of the modeled regions of the Russian Federation, an additional module for configuring the artificial population construction has been implemented. The module is implemented based on the open-source library SynthPops (URL: https://github.com/InstituteforDiseaseModeling/synthpops). The ability to upload the artificial population parameters in the Excel table format has been added to the interface.
A set of pathogen parameters corresponding to the Omicron variant has been added based on literature data. The set of factors for modeling the Omicron variant of the SARS-CoV-2 virus was selected based on a literature search in the PubMed and Google Scholar databases using the following keywords: Omicron transmissibility, transmissibility of Omicron, symptomatic factor, critical factor of Omicron, severe factor of Omicron, death of Omicron, and recovery of asymptomatic Omicron. The search was conducted for articles published since 2021, and 45 publications were selected that presented the parameters necessary for the stochastic agent-based model. To calculate the average median value of these parameters, only studies with a sample size of at least 100 people were used.
Computational experiments were conducted in two stages. The first stage involves using a web interface, the results were evaluated under various scenarios without repetitions. During the second stage, to assess the variability of the results due to the stochastic nature of the model, the most informative scenarios were executed 30 or 100 times (in different tasks) using a Python script.
Results
Covasim Source Code Modifications
The creation of the Population Epidemiological Model (POEM) is based on the open-source programming environment Covasim, with modifications or additions of code to specific modules to implement new features, increase the amount of information, and localization (Table 1).
Table 1. Comparison of Covasim and APOEM
Covasim | POEM |
The susceptibility of the agent to the pathogen is defined discretely based on age category | The susceptibility of the agent to the pathogen is defined according to the chosen distribution option |
The infectivity of an agent is determined by a distribution that is independent of the susceptibility | The infectivity of an agent can be defined in conjunction with the susceptibility to that agent |
Modeling the spread of SARS-CoV-2 variants – Wuhan variant, Alpha, Beta, Gamma, Delta | The ability to model infection caused by the Omicron variant of SARS-CoV-2 has been introduced; there is also the possibility of creating a custom virus variant |
The epidemic spread is modeled within a single synthetic population (a hypothetical city) that is created based on average European demographic and statistical data | The epidemic spread is modeled in parallel for multiple synthetic populations (hypothetical cities) with different set parameters. Model cities are defined as independent of each other or connected by an interaction coefficient. It is possible to build model cities based on real demographic and statistical data |
The ability to model anti-epidemic measures – quarantine, mask mandates, vaccination | The ability to model both one-time (single) and regular mass events has been added |
Anti-epidemic measures are implemented simultaneously and with equal intensity in all institutions of the same type in the hypothetical city | There is the possibility of selectively closing individual schools and businesses when a certain percentage of diagnosed cases is reached (the epidemic threshold) |
The results of the agent testing are reflected on the incidence graph on the day of testing | The test results are displayed on an incidence graph with a delay, calculated based on real data from Rospotrebnadzor (18 million records) |
Basic programming skills are required for setup | Parameter settings and advanced features for visualization in the web version |
1. Assigning susceptibility and infectivity to distribution agents
The key parameters of the infectious process are the susceptibility of individuals to infection (innate and acquired immunity) and contagiousness – the ability of the pathogen to be transmitted from one individual to another. At the same time, contagiousness is considered a characteristic of the pathogen, as individual characteristics of subjects are averaged at the population level. In the agent-based model, it is possible to define an individual agent's ability to spread the virus (e.g., due to a higher viral replication rate, behavioral characteristics, severity of respiratory infection symptoms, or a reduced infectious dose). To describe this characteristic of the agent (subject), the term "infectiousness" will be used below.
The original Covasim code assumes that agents' susceptibility to the virus is rigidly tied to the agent's age (Table 2) [14]. However, the authors of Covasim note that the susceptibility characteristics they adopted contradict the results of another study, where susceptibility to infection did not change with age [15]. At the same time, it is evident that the susceptibility of agents should correspond to mathematical distributions commonly observed in biology, and other studies have investigated, for example, the spread of infection in a population using uniform, Gaussian, and bimodal Gaussian distributions [16].
Тable 2. Age-specific coefficients of susceptibility to the SARS-CoV-2 virus, as defined in the original version of Covasim[14]
Parameter | Age, years | |||||||||
0–9 | 10–19 | 20–29 | 30–39 | 40–49 | 50–59 | 60–69 | 70–79 | 80–89 | 90+ | |
Susceptibility*, % | 0.34 | 0.67 | 1.00 | 1.00 | 1.00 | 1.00 | 1.00 | 1.24 | 1.47 | 1.47 |
Note. *The infection probability coefficient upon contact between agents, used as part of the formula that determines the probability of virus transmission with each contact.
Since the exact characteristics of the distribution of human susceptibility to SARS-CoV-2 and other respiratory viruses are unknown, the possibility of applying the following normalized distributions was included in the POEM model:
- age-stratified susceptibility distribution proposed in the base Covasim model;
- normal (independent of age);
- lognormal (independent of age);
- lognormal, sharply peaked with a thin tail (independent of age).
To ensure the comparability of the impact of the susceptibility distribution on infection spread parameters, the sum of the conditional susceptibility of agents in the population (the area under the susceptibility distribution curve) in the APOEM model is a constant.
In the original Covasim code, the agent's susceptibility characteristic is defined (Table 2), and infectiousness is determined by the probability of pathogen transmission. However, during the spread of COVID-19, significant heterogeneity in the number of infections from a single patient has been described, with 80% of secondary infections being caused by 15% of patients [17]. It is also known that the variability in the amount of SARS-CoV-2 virus detected by PCR testing among different patients (and consequently, the possibility of virus transmission) varied by several orders of magnitude [18]. In the POEM model, the ability to establish a direct relationship between a subject's susceptibility to the virus and its infectiousness was introduced, or to set these parameters as independent, as there is evidence in the literature supporting both options. For example, the ability to become infected and maintain a high level of replication could theoretically be linked to the level of viral receptor expression [19]. On the other hand, it has been shown that some people produce significantly more microdroplets than others and may be more infectious simply because of this [20], meaning that susceptibility and infectiousness may not be linked at the individual level.
2. Implementing a temporary delay in displaying test results
One of the drawbacks of the Covasim base code is the instantaneous availability of results from testing conducted on an artificial population of agents. However, the actual registration of testing data in the overall statistics may be significantly delayed under the increased strain on the healthcare system. The integration of realistic delay into the POEM model, as close as possible to the conditions for recording morbidity in Russia, was performed based on an analysis of records of over 18 million cases of COVID-19, for which the date of a positive sample collection was compared with the date the information was received by Rospotrebnadzor. The resulting distribution of the difference between these dates for each sample was used to determine the probability of receiving delayed data after testing (Table 3).
Table 3. Distribution of the delay in reporting positive test results to Rospotrebnadzor, days after sample collection
Parameter | Delay, days | ||||||||||||||
0 | 1 | 2 | 3 | 4 | 5 | 6 | 7 | 8 | 9 | 10 | 11 | 12 | 13 | 14 | |
Percentage, % | < 1 | 14 | 22 | 12 | 10 | 9 | 7 | 6 | 5 | 4 | 3 | 2 | 2 | 2 | 2 |
3. Implementation of a block forming two or more settlements, with or without their interaction.
The COVID-19 pandemic has demonstrated that imposing isolation on a specific territory or settlement cannot guaranty the prevention of the pathogen's spread. For national health policy formation, modeling an epidemic in a single region without considering its interconnectedness with other regions has limited value. In the original Covasim code, there is an option to model the importation of a fixed number of infected individuals into the simulated population (a specified number of agents become ill each day without a source of infection), while the outflow of infected agents is not provided for. This approach doesn't allow for the dynamics of the epidemic's development in related regions to be taken into account. To overcome this limitation, the ability to model multiple populations (cities) in parallel, with independent parameters for epidemic control measures and the possibility of regulating the movement of agents between them, was developed. In the absence of interaction between cities, each can be considered an independent epidemiological experiment, allowing for a comparison of the effect of population characteristics or the nature of anti-epidemic measures. The interaction coefficient between cities is determined empirically as the percentage of the population travelling between cities each day, reflecting hypothetical transportation flows.
4. Building a model artificial population based on real demographic and sociological data
Modeling the epidemic process under conditions close to real societies is implemented in the APOEM model thru the ability to upload demographic and sociological data for a specific locality or region. The data is provided by the user in the form of an electronic spreadsheet created according to a template and includes population size and its age distribution, household size distribution, educational institution sizes and the number of teachers and other staff working in them, the distribution of workforce sizes, and the employment rate.
As an example of implementing real data loading into the POEM software model, profiles for the following Russian regions have been created: Blagoveshchensk and the Amur region, Nizhny Novgorod and the Nizhny Novgorod region, Voronezh and the Voronezh region.
5. Modeling the spread of the Omicron variant
In late November 2021, the WHO designated a new genetic variant of SARS-CoV-2 as a variant of concern (B.1.1.529), naming it Omicron [21]. At the time this SARS-CoV-2 variant emerged, it had several times more mutations in the spike protein than any other variant [22]. Thanks to these mutations, the Omicron variant of the virus binds more effectively to the host cell's ACE2 receptors compared to previous variants. Most neutralizing antibodies produced by vaccinated individuals or those who have recovered from other SARS-CoV-2 variants are ineffective against Omicron, but it is associated with milder symptoms and a higher proportion of asymptomatic carriers compared to other variants [23].
The degree of danger of a coronavirus variant depends on factors such as contagiousness, immune evasion, and the severity of the clinical course of the infection [24]. The basic reproduction number (R0) of the Omicron variant is 8.2 [25], which corresponds to a much more effective spread compared to earlier virus variants. In the original Covasim environment, the transmissibility of virus variants is implemented based on coefficients relative to the original Wuhan variant. In the POEM model, the probability of infection transmission from agent to agent was set to 3.34 (relative to the Wuhan variant), calculated as the average obtained from the analysis of several publications. The probability of symptomatic infection with the Omicron variant was established at 0.1 based on a multicenter retrospective observational study conducted in Shanghai [26]. The risk of hospitalization with the Omicron variant infection was 56% lower compared to the Delta variant [27], and the risk of severe illness was 2–3 times lower [28]. Based on a systematic review and meta-analysis of severity and clinical outcomes in people infected with the Omicron variant, an odds ratio of 0.46 for critical illness compared to the Delta variant and an odds ratio of 0.39 for mortality were used. According to the literature, the incubation period (in the terminology of the Covasim platform, actually the latent period, the time from infection to the onset of viral shedding) for the Omicron variant is about 2–3 days, and the average duration of the asymptomatic period is 2.2 days [29].
The median duration of virus detection was 9 days (ranging from 7 days in asymptomatic cases to 10 days in severe cases) [30]. Acute symptoms in those infected with the Omicron variant were observed for a shorter period – an average of 6.9 days, compared to patients infected with Delta, who experienced symptoms for an average of 8.9 days [24]. The length of stay in intensive care units for Omicron variant infections was 5 days shorter than for Delta variant infections, with a median value of 5.3 days [31]. The overall mortality rate was higher for patients with the Delta variant, at 0.5%, compared to patients with the Omicron variant (0.1%). The average time from diagnosis to death when infected with the Delta variant was 13 days, compared to 10 days with the Omicron variant [31].
Computational experiments
1. Mass gathering modeling
Mass gatherings have a significant impact on the dynamics of epidemics [32–34] and are one of the priority targets for epidemic control measures.
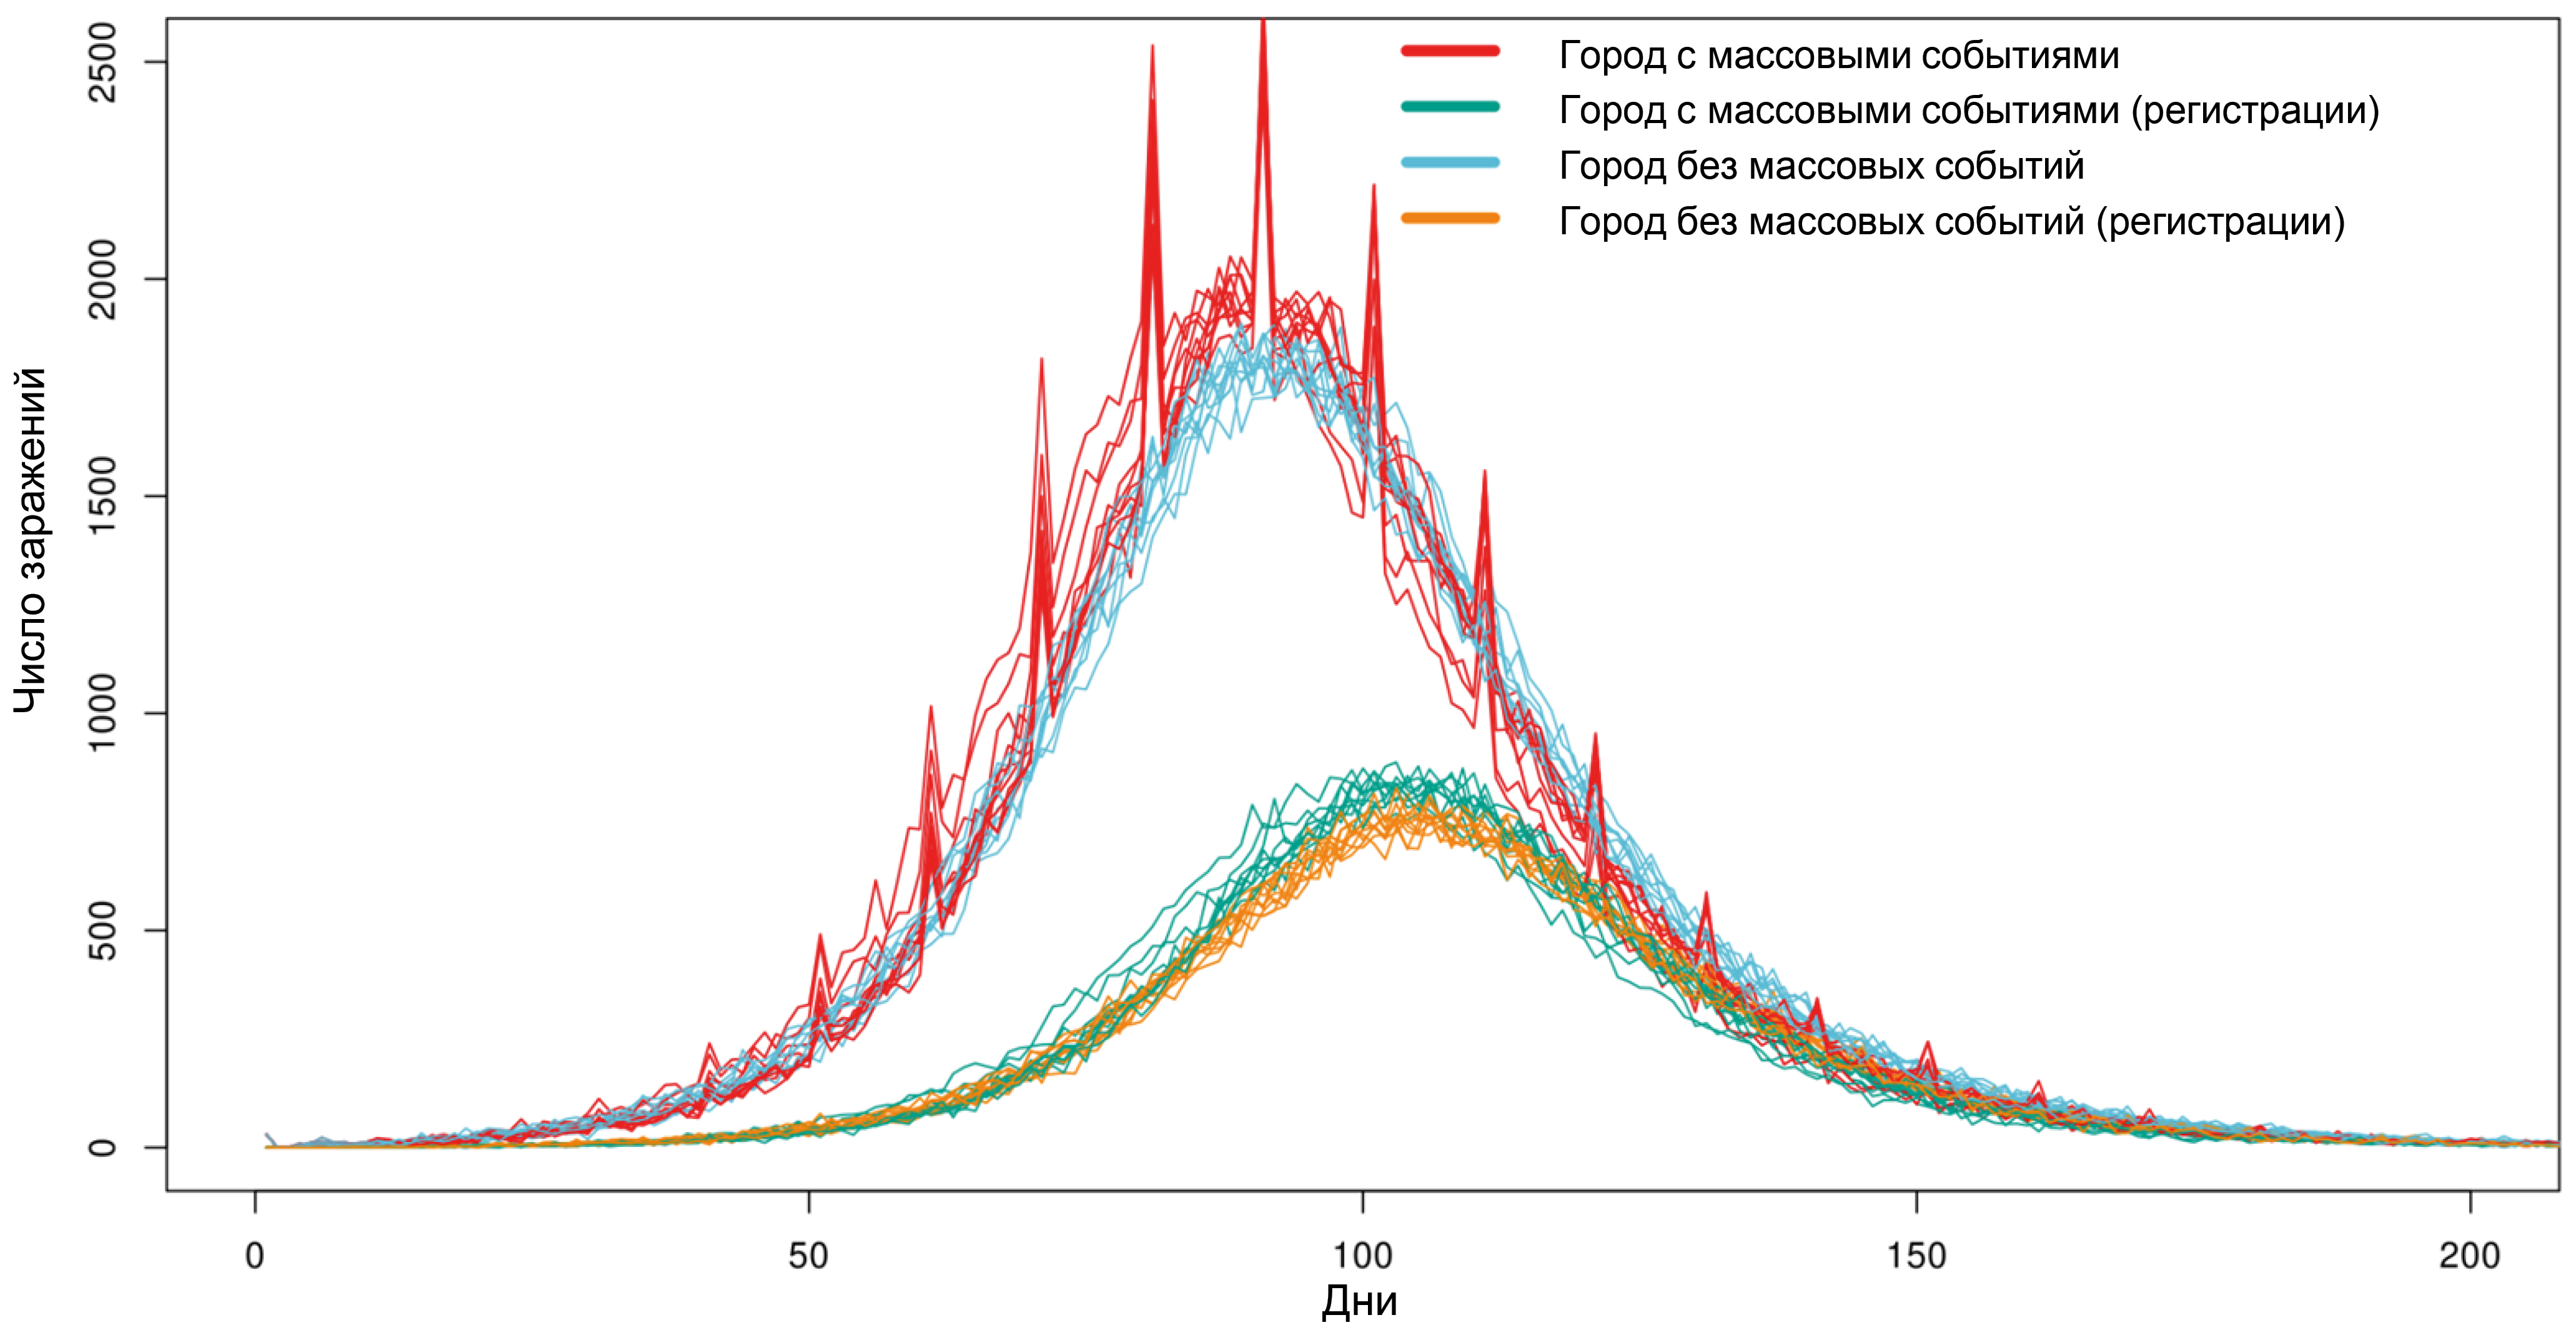
Two cities with a population of 100,000 agents have been given, with anti-epidemic measures in place in the form of social distancing (reducing the frequency of random contacts by 50%, and contacts at school and work by 90%). On the first day in both cities, 30 people were infected with the Delta variant of SARS-CoV-2. The probabilities of testing asymptomatic and symptomatic agents were 1% and 10%, respectively. Every 10 days, mass events are held in one of the cities, with a total number of participants equal to 20,000. The results of 10 simulations for each city are presented in Fig. 1. The occurrence of mass events leads to a sharp increase in the number of infected individuals in the model. However, even a significant number of simultaneous infections (500–1000 compared to the usual 1000–2000 infected per day) cannot be detected through daily testing due to the smoothing of the incidence rate caused by the varying lengths of the incubation period and the uneven delay in reporting positive results, which negates sharp increases in infections.

Fig. 1. The impact of holding mass gatherings on the number of SARS-CoV-2 infections in a city with a population of 100,000 agents.
2. Modeling of anti-epidemic measures
The most severe clinical course of COVID-19 was observed in older individuals. The most intensive anti-epidemic measures were aimed at protecting the at-risk age group. One of the common measures to reduce morbidity was the closure of schools to decrease the spread of the virus in society and, consequently, the risk of household transmission to the elderly. Individual examples of the impact of school closures on reducing infections in the elderly have been described [35], but overall, epidemiological data do not confirm the effectiveness of such measures with sufficient certainty, and the results of mathematical modeling described earlier have been contradictory [36, 37].
The following hypothetical scenarios were tested on the POEM model. The most effective measures (100% isolation of all contacts) were applied only to young people (< 20 years old) or only to the elderly (> 60 years old) on days 30–90 or 60–120 after the start of the epidemic (at the time the measures were implemented, approximately 1% or 20% of the population was infected, respectively), with the assumption that administrative resources allowed for restrictions to be in place for only 60 days.
When measures were implemented early, during low COVID-19 prevalence, there was a pronounced effect on the number of infected individuals. However, due to the lifting of restrictions on day 90, by day 140, the number of infected individuals in all groups was practically indistinguishable (Fig. 2). Meanwhile, isolation of both young people and, especially, the elderly led to a 17% and 35% reduction in deaths, respectively, although the confidence intervals for these results partially overlapped.

Fig. 2. The impact of implementing anti-epidemic measures on morbidity and mortality across different age groups.
The blue line on the graph represents the results when young individuals were isolated, and the red line represents the results when elderly individuals were isolated. The green line represents epidemic modeling in the city without the implementation of measures.
The late implementation of measures to isolate young people led to a 25% decrease in the number of cases, but the reduction in fatalities was less pronounced, at 16%. Late isolation of the elderly led to a smaller decrease in overall morbidity, but a significant reduction in mortality (66%). Thus, isolating young people may have an effect on the incidence of illness in the elderly, but less noticeable than the direct isolation of the elderly.
The modeling results obtained are consistent with the understanding that the later separation of organized children's and adolescent groups, implemented during the rise in COVID-19 incidence, is accompanied by an intensification of infection transmission within households due to longer and closer domestic contact (students transferred to distance learning infect elderly individuals who are temporarily involved in supervising minors).
3. Passenger flow modeling
During the COVID-19 pandemic, restrictions on movement between cities and countries were almost universal and aimed to prevent the virus from being brought into the region from areas with an unfavorable epidemiological situation. To model the effectiveness of traffic flow restrictions, a simulation of the epidemic's spread was conducted in two cities. In both cities, anti-epidemic measures were implemented on the 50th day of the simulation (soft measures in the first city, strict ones in the second). On the 90th day of the simulation, only mild epidemic control measures were implemented in both cities, which continued until the end of the simulation. Soft epidemic control measures included only mandatory mask-wearing at work and in public places with a conditional effectiveness of 25%, hard measures included mandatory mask-wearing at work and in public places with a conditional effectiveness of 75%, and school closures. The spread of the epidemic was modeled under conditions of minimal transportation flows (0.01% of the population moving between cities daily), average flows (0.1% of the population daily, roughly corresponding to transportation flows between Moscow and St. Petersburg), and intensive flows (1% of the population daily).
In the city with mild measures, the number of cases reached 60,000 by day 200 (compared to 72,000 without measures), and the number of deaths was 210 compared to 275 (Fig. 3). With minimal traffic flow, the number of cases in the city with strict measures reached 50,000 by the 200th day, and the number of deaths was 130. With moderate traffic flow, the number of cases in the city with strict measures has barely changed, while the number of deaths has increased to 150. With heavy traffic flow, the effect of strict epidemic control measures in the second city was practically nullified.

Fig. 3. The impact of intercity traffic flows on morbidity and mortality at different levels of implementation of anti-epidemic measures.
The blue line on the graph shows the simulation results for the city with the most effective measures, and the red line shows the results for the city with less strict measures. The green line shows modeling an epidemic in the city without the implementation of measures and with no transportation. Dotted lines show the dates of the implementation and cancelation of measures and the end of the simulation.
4. Modeling the introduction of measures when a threshold number of cases is reached
A classic tool in epidemiology is the implementation of anti-epidemic measures upon reaching a set level (epidemic threshold). This method is well-established for influenza1. Since epidemic threshold values have not been developed for COVID-19, three fairly strict values were tested in the modeling: 20, 70 and 150 cases per 10,000 population. At the same time, it was agreed that administrative resources are limited, and strict measures (mask mandate with 70% effectiveness in public places and at work, school closures) will only be implemented for 30 days, followed by another 30 days of less stringent measures (mask mandate with 30% effectiveness in public places, at work, and in schools). Epidemiological measures had an immediate effect on the pathogen transmission efficiency in the model population (reducing the effective reproductive number below 1). The total number of infected individuals was 30–35 thousand in all scenarios, but the number of deaths in the case of the latest implementation of measures (when the total number of diagnosed cases reached 150 per 10 thousand population) reached 145, while in all other scenarios the values were in the range of 91–111 people (Fig. 4). Thus, the POEM model allows for simulating the development of an epidemic under the conditions of the response standards adopted in Russia for disease spread, and accounting for registration delays based on real data allows for planning the fight against the spread of infection, taking this factor into account.

Fig. 4. The impact of implementing epidemic control measures upon reaching the threshold of registered cases on incidence and mortality.
The blue line on the graph shows the simulation results when measures are implemented upon reaching a threshold of 20 diagnosed cases, the red line shows the results when the threshold is 70, the green line shows the results when the threshold is 150 diagnosed cases, and the purple line represents the modeling of the epidemic in the city without the implementation of measures.
5. Modeling the circulation of two virus variants
The Voronezh region was chosen as a model, because a sufficiently large number of SARS-CoV-2 virus whole-genome sequences were available on the VGARus platform in December 2021 – January 2022, allowing for a comparison of the calculated ratio of virus variants in the simulation and the actually observed one. Demographic data was loaded into the model, and based on this, a digital replica of the Voronezh region was created. On April 1, 2021, 30 agents infected with the Delta variant appeared in it, and on December 15, 2021, 30 agents infected with the Omicron variant appeared. This simulation was repeated 100 times, and the results are presented in Fig. 5. The Pearson correlation coefficient between the average result from 100 simulations and the real data for the proportion of the Omicron variant among circulating SARS-CoV-2 in the population was 0.9985.

Fig. 5. Simulation of the dominant SARS-CoV-2 variant change in the Voronezh region in the winter of 2021–2022.
a — graph of the daily number of infected individuals, broken down by SARS-CoV-2 variant. The Delta variant is marked in green, and the Omicron variant is marked in red. The daily number of infections in 100 simulations is shown in pale colors, and the average values are shown in bright colors;
b — the proportion of the Omicron variant among the SARS-CoV-2 circulating in the Voronezh region. The values calculated from the results of 100 simulations are shown in light blue, the average value is in dark blue, and the real data from the whole-genome sequencing analysis results are in red.
Discussion
Computational epidemiology is a new field of knowledge that combines the principles of classical epidemiology, statistics, mathematics and computer science to analyze large datasets, model the spread of diseases in the human population, and inform public health policy.
A successful example of implementing this approach is the Baroyan–Rvačev model for predicting influenza epidemics in the USSR [38]. The model used detailed data on intercity migration flows, which allowed for highly accurate predictions of the start of the epidemic process and its peak in the capitals of the union republics.
The rapid development of computational technologies in the late 20th and early 21st centuries allowed for the transition to large-scale agent-based modeling with explicit interactions between individuals to simulate the spread of infectious diseases. The development of such approaches allows for a number of fundamental features to be taken into account: the diversity of agents (e.g., age, gender, social status, etc.), the heterogeneity of social contacts, migration flows, the implementation of disease control measures for specific population groups, etc. The COVID-19 pandemic fully demonstrated the need to utilize the predictive power of stochastic discrete models for conducting computational epidemiological experiments to select the optimal set of response measures.
The Covasim agent-based modeling platform, combined with the SynthPops synthetic population creation module, is currently one of the most advanced in epidemiology. Over the past 3 years, a significant amount of research has been conducted using Covasim to develop measures to prevent the spread of epidemics, such as:
- studying test strategies and impact of test characteristics [4, 9, 39];
- studying the effectiveness of isolation and quarantine [6, 39];
- modeling the achievement of herd immunity [10];
- analysis of vaccination strategies [6, 11, 12];
- assessing the risks of the consequences of rescinding management decisions [8, 40].
In certain cases, the objectives were achieved by expanding, calibrating, or modifying the Covasim model. The most extensive additions were proposed in the new ProMES model based on Covasim [41].
This study presents the POEM model, which overcomes the limitations associated with using the Covasim platform for the population of various regions of the Russian Federation and adds a number of new features that allow for computational experiments with greater detail and reliability than provided by the original code.
Agent susceptibility profiles to SARS-CoV-2 have been developed, reflecting the latest accumulated data, which differ from the results of early COVID-19 studies. A population structure based on real demographic data and a correct registration delay based on an analysis of 18 million COVID-19 cases have been implemented. The ability to assess the role of mass gatherings and traffic flows has been added, and based on a meta-analysis of published data, the ability to simulate Omicron variant morbidity has been added. The web interface for running simulations and visualizing results makes it possible for users without programming skills to work with the POEM software platform. For scientific research, it is possible to run multiple simulations with statistical significance assessment and output of results not only in graphical format but also as the raw values of all parameters.
Digital epidemiological experiments performed to demonstrate the model capabilities show that the model corresponds to the actually observed development of epidemics and the effect of anti-epidemic measures. At the same time, the model allows for practicing not only standard but also extreme scenarios, such as the emergence of highly contagious pathogens. Since the key constraint during the COVID-19 pandemic was public acceptance of restrictions, using the APOEM platform makes it possible to select the most effective measures, taking into account limited administrative resources. The Covasim model was developed with a focus on performance, ease of use and flexibility: realistic scenarios can be run on a standard laptop in less than a minute [3]. In the POEM system, modeling an epidemic in a population of 100,000 people over 180 days and generating all the graphs takes 30 seconds on a single-core processor. Simulating a population of 1 million people over 180 days takes 6 minutes.
The limitation of the POEM platform is the lack of epidemic development prediction functions. There are studies where this possibility is implemented by dynamically adjusting the virus transmission efficiency based on current morbidity data. This approach can be quite effective for short-term (around 2 weeks) disease prediction, but the primary goal of this work was to reproduce the population and epidemic spread in as much detail as possible to develop epidemic control strategies. Dynamically adjusting the model is an easy way to compensate for model imperfections, but it can reduce its value as a planning tool.
Conclusion
POEM is the first platform in Russia for agent-based modeling of epidemics, which is expected to be accessible to a wide range of professional epidemiologists in the future. The model flexibility allows for virtually unlimited scaling of the platform by adding regions and traffic flows based on demographic and statistical data, defining new variants of the coronavirus and other pathogens. The model is fully implemented within the Russian framework on the server of the Research Institute of System Biology and Medicine of Rospotrebnadzor and can be used to conduct digital epidemiological experiments to predict the effectiveness of anti-epidemic measures in the Russian Federation.
1 State Sanitary and Epidemiological Rationing of the Russian Federation. 3.1.2. Respiratory tract infections. Methodology for calculating epidemic thresholds for influenza and acute respiratory viral infections in the subjects of the Russian Federation. Methodological recommendations. MP 3.1.2.0118-17. Moscow; 2017.
About the authors
Anna Yu. Popova
Federal Service for Supervision of Consumer Rights Protection and Human Welfare
Email: samoilov_ae@sysbiomed.ru
ORCID iD: 0000-0003-2567-9032
D. Sci. (Med.), Professor, Head
Russian Federation, MoscowAsiya F. Ayupova
Research Institute for Systems Biology and Medicine
Email: asiya.bun@gmail.com
ORCID iD: 0000-0002-7038-3911
researcher, Laboratory of molecular epidemiology of emerging infections
Russian Federation, MoscowVadim M. Govorun
Research Institute for Systems Biology and Medicine
Email: govorun@sysbiomed.ru
ORCID iD: 0000-0003-0837-8764
Dr Sci. (Biol.), Professor, Academician of the Russian Academy of Sciences, Director
Russian Federation, MoscowAlina A. Gorbacheva
Research Institute for Systems Biology and Medicine
Email: mantodea13@gmail.com
ORCID iD: 0009-0009-7750-370X
researcher, Laboratory of molecular epidemiology of emerging infections
Russian Federation, MoscowElena N. Ilina
Research Institute for Systems Biology and Medicine
Email: ilinaen@sysbiomed.ru
ORCID iD: 0000-0003-0130-5079
Dr Sci. (Biol.), Corresponding Member of the Russian Academy of Sciences, main researcher, Head, Laboratory of mathematical biology and bioinformatics
Russian Federation, MoscowViacheslav N. Kachalov
Research Institute for Systems Biology and Medicine; Moscow Institute of Physics and Technology, National Research University
Email: kachalov_vn@sysbiomed.ru
ORCID iD: 0000-0002-0310-3764
senior researcher, Laboratory of mathematical biology and bioinformatics, Research Institute of Systems Biology and Medicine; Associate Professor, Moscow Institute of Physics and Technology (National Research University)
Russian Federation, Moscow; DolgoprudnyIvan E. Kozlov
Research Institute for Systems Biology and Medicine
Email: ivan.kozzloff98@gmail.com
ORCID iD: 0009-0007-2437-5527
assistant researcher, Laboratory of mathematical biology and bioinformatics
Russian Federation, MoscowKonstantin A. Klochkov
Research Institute for Systems Biology and Medicine; Moscow Institute of Physics and Technology, National Research University
Email: konstantin.a.klochkov@gmail.com
ORCID iD: 0009-0008-2839-6189
junior researcher, Laboratory of mathematical biology and bioinformatics, Research Institute of Systems Biology and Medicine; student, Moscow Institute of Physics and Technology (National Research University)
Russian Federation, Moscow; DolgoprudnyVladimir V. Kutyrev
Russian Research Anti-Plague Institute “Microbe”
Email: rusrapi@microbe.ru
ORCID iD: 0000-0003-3788-3452
Dr Sci. (Med.), Professor, Academician of the Russian Academy of Sciences, Director
Russian Federation, SaratovAlexander N. Lukashev
Research Institute for Systems Biology and Medicine; Sechenov First Moscow State Medical University
Email: alexander_lukashev@hotmail.com
ORCID iD: 0000-0001-7365-0352
Dr Sci. (Biol.), Corresponding Member of the Russian Academy of Sciences, main researcher, principal researcher, Research Institute of Systems Biology and Medicine; Director, Martsinovsky Institute of Medical Parasitology, Tropical and Vector Borne Diseases, Sechenov First Moscow State Medical University
Russian Federation, Moscow; MoscowAlexander I. Manolov
Research Institute for Systems Biology and Medicine
Email: paraslonic@gmail.com
ORCID iD: 0000-0003-3912-429X
Cand. Sci. (Biol.), researcher, Scientific
Russian Federation, MoscowIrina I. Maslova
Research Institute for Systems Biology and Medicine
Email: maslova1ira@gmail.com
ORCID iD: 0009-0000-0849-9123
junior researcher, Laboratory of mathematical biology and bioinformatics
Russian Federation, MoscowAndrei E. Samoilov
Research Institute for Systems Biology and Medicine
Author for correspondence.
Email: samoilov_ae@sysbiomed.ru
ORCID iD: 0000-0001-8284-3164
researcher, Laboratory of mathematical biology and bioinformatics
Russian Federation, MoscowValentin A. Safronov
Russian Research Anti-Plague Institute “Microbe”
Email: safronov64@gmail.com
ORCID iD: 0000-0001-9563-2833
leading redearcher
Russian Federation, SaratovVera I. Tsurkis
Research Institute for Systems Biology and Medicine
Email: veratsurkis21@gmail.com
ORCID iD: 0009-0001-5140-0990
junior researcher, Laboratory of mathematical biology and bioinformatics
Russian Federation, MoscowReferences
- Маслова И.И., Манолов А.И., Глущенко О.Е. и др. Ограничения в создании искусственных популяций в агентном моделировании эпидемий: систематический обзор. Журнал микробиологии, эпидемиологии и иммунобиологии. 2024;101(4):530–45. Maslova I.I., Manolov A.I., Glushchenko O.E., et al. Limitations in creating artificial populations in agent-based epidemic modeling: a systematic review. Journal of Microbiology, Epidemiology and Immunobiology. 2024;101(4):530–45. DOI: https://doi.org/10.36233/0372-9311-467 EDN: https://elibrary.ru/goxztx
- Grefenstette J.J., Brown S.T., Rosenfeld R., et al. FRED (a Framework for Reconstructing Epidemic Dynamics): an open-source software system for modeling infectious diseases and control strategies using census-based populations. BMC Public Health. 2013;13(1):940. DOI: https://doi.org/10.1186/1471-2458-13-940
- Kerr C.C., Stuart R.M., Mistry D., et al. Covasim: an agent-based model of COVID-19 dynamics and interventions. PLoS Comput. Biol. 2021;17(7):e1009149. DOI: https://doi.org/10.1371/journal.pcbi.1009149
- Silva M.E.P., Fyles M., Pi L., et al. The role of regular asymptomatic testing in reducing the impact of a COVID-19 wave. Epidemics. 2023;44(100699):100699. DOI: https://doi.org/10.1016/j.epidem.2023.100699
- Panovska-Griffiths J., Swallow B., Hinch R., et al. Statistical and agent-based modelling of the transmissibility of different SARS-CoV-2 variants in England and impact of different interventions. Philos. Trans. A Math. Phys. Eng. Sci. 2022;380(2233):20210315. DOI: https://doi.org/10.1098/rsta.2021.0315
- Panovska-Griffiths J., Stuart R.M., Kerr C.C., et al. Modelling the impact of reopening schools in the UK in early 2021 in the presence of the alpha variant and with roll-out of vaccination against SARS-CoV-2. J. Math. Anal. Appl. 2022;514(2):126050. DOI: https://doi.org/10.1016/j.jmaa.2022.126050
- Panovska-Griffiths J., Kerr C.C., Stuart R.M., et al. Determining the optimal strategy for reopening schools, the impact of test and trace interventions, and the risk of occurrence of a second COVID-19 epidemic wave in the UK: a modelling study. Lancet Child Adolesc. Health. 2020;4(11):817–27. DOI: https://doi.org/10.1016/S2352-4642(20)30250-9
- Scott N., Abeysuriya R.G., Delport D., et al. COVID-19 epidemic modelling for policy decision support in Victoria, Australia 2020–2021. BMC Public Health. 2023;23(1):988. DOI: https://doi.org/10.1186/s12889-023-15936-w
- Sanz-Leon P., Stevenson N.J., Stuart R.M., et al. Risk of sustained SARS-CoV-2 transmission in Queensland, Australia. Sci. Rep. 2022;12(1):6309. DOI: https://doi.org/10.1038/s41598-022-10349-y
- Sanz-Leon P., Hamilton L.H.W., Raison S.J., et al. Modelling herd immunity requirements in Queensland: impact of vaccination effectiveness, hesitancy and variants of SARS-CoV-2. Philos. Trans. A Math. Phys. Eng. Sci. 2022;380(2233):20210311. DOI: https://doi.org/10.1098/rsta.2021.0311
- Li J., Giabbanelli P. Returning to a normal life via COVID-19 vaccines in the United States: a large-scale agent-based simulation study. JMIR Med. Inform. 2021;9(4):e27419. DOI: https://doi.org/10.2196/27419
- Cattaneo A., Vitali A., Mazzoleni M., Previdi F. An agent-based model to assess large-scale COVID-19 vaccination campaigns for the Italian territory: the case study of Lombardy region. Comput. Methods Programs Biomed. 2022;224(107029):107029. DOI: https://doi.org/10.1016/j.cmpb.2022.107029
- Moritz S., Gottschick C., Horn J., et al. The risk of indoor sports and culture events for the transmission of COVID-19. Nat. Commun. 2021;12(1):5096. DOI: https://doi.org/10.1038/s41467-021-25317-9
- Zhang J., Litvinova M., Liang Y., et al. Changes in contact patterns shape the dynamics of the COVID-19 outbreak in China. Science. 2020;368(6498):1481–6. DOI: https://doi.org/10.1126/science.abb8001
- Bi Q., Wu Y., Mei S., et al. Epidemiology and transmission of COVID-19 in 391 cases and 1286 of their close contacts in Shenzhen, China: a retrospective cohort study. Lancet Infect. Dis. 2020;20(8):911–9. DOI: https://doi.org/10.1016/S1473-3099(20)30287-5
- Mukherjee S., Mondal S., Bagchi B. Stochastic formulation of multiwave pandemic: decomposition of growth into inherent susceptibility and external infectivity distributions. J. Chem. Sci (Bangalore). 2021;133(4):118. DOI: https://doi.org/10.1007/s12039-021-01981-8
- Sun K., Wang W., Gao L., et al. Transmission heterogeneities, kinetics, and controllability of SARS-CoV-2. Science. 2021;371(6526):eabe2424. DOI: https://doi.org/10.1126/science.abe2424
- To K.K.W., Tsang O.T.Y., Leung W.S., et al. Temporal profiles of viral load in posterior oropharyngeal saliva samples and serum antibody responses during infection by SARS-CoV-2: an observational cohort study. Lancet Infect. Dis. 2020;20(5):565–74. DOI: https://doi.org/10.1016/S1473-3099(20)30196-1
- Devaux C.A., Rolain J.M., Raoult D. ACE2 receptor polymorphism: susceptibility to SARS-CoV-2, hypertension, multi-organ failure, and COVID-19 disease outcome. J. Microbiol. Immunol. Infect. 2020;53(3):425–35. DOI: https://doi.org/10.1016/j.jmii.2020.04.015
- Edwards D.A., Ausiello D., Salzman J., et al. Exhaled aerosol increases with COVID-19 infection, age, and obesity. Proc. Natl Acad. Sci. USA. 2021;118(8):e2021830118. DOI: https://doi.org/10.1073/pnas.2021830118
- Willett B.J., Grove J., MacLean O.A., et al. SARS-CoV-2 Omicron is an immune escape variant with an altered cell entry pathway. Nat. Microbiol. 2022;7(8):1161–79. DOI: https://doi.org/10.1038/s41564-022-01143-7
- Callaway E. Heavily mutated Omicron variant puts scientists on alert. Nature. 2021;600(7887):21. DOI: https://doi.org/10.1038/d41586-021-03552-w
- Barut G.T., Halwe N.J., Taddeo A., et al. The spike gene is a major determinant for the SARS-CoV-2 Omicron-BA.1 phenotype. Nat. Commun. 2022;13(1):5929. DOI: https://doi.org/10.1038/s41467-022-33632-y
- Zhang H., Huang C., Gu X., et al. 3-year outcomes of discharged survivors of COVID-19 following the SARS-CoV-2 omicron (B.1.1.529) wave in 2022 in China: a longitudinal cohort study. Lancet Respir. Med. 2024;12(1):55–66. DOI: https://doi.org/10.1016/S2213-2600(23)00387-9
- Liu Y., Rocklöv J. The effective reproductive number of the Omicron variant of SARS-CoV-2 is several times relative to Delta. J. Travel Med. 2022;29(3): taac037. DOI: https://doi.org/10.1093/jtm/taac037
- Chen Z., Deng X., Fang L., et al. Epidemiological characteristics and transmission dynamics of the outbreak caused by the SARS-CoV-2 Omicron variant in Shanghai, China: a descriptive study. Lancet Reg. Health West Pac. 2022;29(100592):100592. DOI: https://doi.org/10.1016/j.lanwpc.2022.100592
- Zheng Y., Zhang H., Weng Z., et al. Clinical characteristics and predictors of delayed discharge among children with SARS-CoV-2 Omicron variant infection. Biomed. Rep. 2024;20(2):29. DOI: https://doi.org/10.3892/br.2023.1717
- Zhang W., Wu H., Guo Q., et al. Association of clinical characteristics and vaccines with risk of persistently viral clearance in patients infected with SARS-CoV-2 Omicron variant in Shanghai, China. Heliyon. 2024;10(1):e23256. DOI: https://doi.org/10.1016/j.heliyon.2023.e23256
- Сизикова Т.Е., Чухраля О.В., Лебедев В.Н., Борисевич С.В. Вариант омикрон вируса SARS-CoV-2: способность вызывать заболевание у лиц, имеющих иммунитет против COVID-19, сформированный в результате вакцинации или ранее перенесенного заболевания. Вестник войск РХБ защиты. 2023;6(1):44–55. Sizikova T.E., Chuhralya O.V., Lebedev V.N., Borisevich S.V. The omicron variant of SARS-CoV-2 virus: The ability to cause disease in persons with immunity against COVID-19. Journal of NBC Protection Corps. 2023;6(1):44–55. DOI: https://doi.org/10.35825/2587-5728-2022-6-1-44-55 EDN: https://elibrary.ru/jfxeeb
- Li Y., Jiang X., Qiu Y., et al. Latent and incubation periods of Delta, BA.1, and BA.2 variant cases and associated factors: a cross-sectional study in China. BMC Infect. Dis. 2024;24(1):294. DOI: https://doi.org/10.1186/s12879-024-09158-7
- Zhang L., Kang X., Wang L., et al. Clinical and virological features of asymptomatic and mild symptomatic patients with SARS-CoV-2 Omicron infection at Shanghai Fangcang shelter hospital. Immun. Inflamm. Dis. 2023;11(9):e1033. DOI: https://doi.org/10.1002/iid3.1033
- Che Mat N.F., Edinur H.A., Abdul Razab M.K.A., Safuan S. A single mass gathering resulted in massive transmission of COVID-19 infections in Malaysia with further international spread. J. Travel. Med. 2020;27(3):taaa059. DOI: https://doi.org/10.1093/jtm/taaa059
- Memish Z.A., Steffen R., White P., et al. Mass gatherings medicine: public health issues arising from mass gathering religious and sporting events. Lancet. 2019;393(10185):2073–84. DOI: https://doi.org/10.1016/S0140-6736(19)30501-X
- Hoang V.T., Gautret P. Infectious diseases and mass gatherings. Curr. Infect. Dis. Rep. 2018;20(11):44. DOI: https://doi.org/10.1007/s11908-018-0650-9
- Chung P.C., Chen K.J., Chang H.M., Chan T.C. Evaluating the effectiveness of school closure in COVID-19-related syndromes from community-based syndromic surveillance: longitudinal observational study. Interact. J. Med. Res. 2023;12:e44606. DOI: https://doi.org/10.2196/44606
- Viner R.M., Russell S.J., Croker H., et al. School closure and management practices during coronavirus outbreaks including COVID-19: a rapid systematic review. Lancet Child Adolesc. Health. 2020;4(5):397–404. DOI: https://doi.org/10.1016/S2352-4642(20)30095-X
- Hume S., Brown S.R., Mahtani K.R. School closures during COVID-19: an overview of systematic reviews. BMJ Evid. Based. Med. 2023;28(3):164–74. DOI: https://doi.org/10.1136/bmjebm-2022-112085
- Бароян О.В., Рвачев Л.А. Математика и эпидемиология. М.;1977. Baroyan O.V., Rvachev L.A. Mathematics and Epidemiology. Moscow;1977.
- Kerr C.C., Mistry D., Stuart R.M., et al. Controlling COVID-19 via test-trace-quarantine. Nat. Commun. 2021;12(1):2993. DOI: https://doi.org/10.1038/s41467-021-23276-9
- Scott N., Palmer A., Delport D., et al. Modelling the impact of relaxing COVID-19 control measures during a period of low viral transmission. Med. J. Aust. 2021;214(2):79–83. DOI: https://doi.org/10.5694/mja2.50845
- Latkowski R., Dunin-Kȩplicz B. An agent-based COVID-19 simulator: extending Covasim to the Рolish context. Procedia Comput. Sci. 2021;192:3607–16. DOI: https://doi.org/10.1016/j.procs.2021.09.134
Supplementary files

