


Dampening of proteomics activity associated with the COVID-19 patients afflicted with asthma based on gene expression pattern
- Authors: Dawood A.A.1
-
Affiliations:
- University of Mosul
- Issue: Vol 101, No 1 (2024)
- Pages: 133-142
- Section: ORIGINAL RESEARCHES
- URL: https://microbiol.crie.ru/jour/article/view/8474
- DOI: https://doi.org/10.36233/0372-9311-399
- EDN: https://elibrary.ru/vuherl
- ID: 8474

Cite item
Full Text

Abstract
Introduction. It is established that the severity of SARS-CoV-2 infections varies between individuals without underlying health conditions and those with chronic illnesses like asthma.
Aim: to assess the gene expression of COVID-19 patients with and without asthma.
Materials and Methods. 20 patient profiles out of a total of 288 were selected from Gene Expression Omnibus (GSE178399). All patients have positive PCR tests and were divided into 4 groups. GEO2R was used to estimate the comparison between groups. STRING tool was used to measure the correlation between genes. The phylogenetic tree was extracted using iTOL. The heat map was extracted using iDEP.96.
Results. MMP10 (Matrix metalloproteinase-10), TNFRSF11B (Tumor necrosis factor receptor superfamily member 11B), CCL23 (C-C motif chemokine ligand 23), CD274 (Programmed cell death 1) CX3CL1 (C-X3-C motif chemokine), and IL17C (Interleukin-17C) had down-regulation for all patients. Transcriptome data conducted no correlation between the expression of MMP10 and asthma, although there is a significant correlation between the expression of MMP1 and sensitivity. The expression of IL17A, which is strongly related to allergic asthma, is decreased in non-asthmatic individuals but elevated in asthmatic patients, notably in survivors. Patients who were not asthmatic had significantly higher CXCL9 levels.
Conclusions. The study revealed a disparity in the relationship between imbalanced gene expressions in the groups examined. The gene expression of asthma patients who survived and died was not significantly different.
Keywords
Full Text
Introduction
Even though the occurrence of COVID-19 infections has decreased, this doesn't eliminate the possibility of new variants emerging [1]. The alterations that occurred in the virus were responsible for both the increase and decrease in fatalities. Vaccines also played a significant impact in the decrease of the epidemic [2, 3]. Medical conditions that had been related to a higher risk of hospitalization and death from COVID-19 infection have been found through epidemiological research [4]. Patients with underlying health issues, such as cardiovascular disease, hypertension, asthma, or advanced age, had a greater chance of dying. Current research into the molecular pathways triggered by SARS-CoV-2 infection is actively evaluating genomic and proteomic patterns [5].
The multi-organ inflammatory response that results from the patient's immune system reaction to COVID-19 is a substantial contributor to the disease's severity. Several types of research have hinted at the part played by circulating immune cells in pandemic severe respiratory syndrome [6, 7]. During the early phases of SARS-CoV-2 infection, the immune response primarily targets the spike glycoprotein. A cross-sectional study revealed that individuals with COVID-19 exhibited a decreased proportion of T-helper cells producing IFNγ. However, the actual impact of immune cell responses on infection outcomes hasn't been definitively confirmed through clinical results [8, 9].
It is well established that in response to a pathogen, immune cells release cytokines and immunological complexes. Thus, the over-secretion of these immunological complexes onto normal cells of the body may expose the human to an immune setback [10, 11].
The significance of immunity complexes in COVID-19 patients could be better understood if the interplay of key immunological axes were studied, especially in individuals with specific chronic diseases like asthma. The severity of asthma and the ability to control asthma are two distinct but related aspects of each patient's condition [12]. Asthma exacerbations and deterioration in symptoms are linked to factors like resistance to therapy or the existence of risk factors such as viral respiratory infection. When respiratory infections or other diseases trigger asthma exacerbations, the patient's health deteriorates and their prognosis worsens [13].
The purpose of this research is to assess gene expression between COVID-19 asthma and non-asthmatic patients.
Materials and Methods
A pilot study was conducted to detect thousands of genes using microarrays in samples оf 288 COVID-19 positive patients. Within this group, there was a subset of individuals who had asthma at varying degrees of severity. From this larger cohort, a specific subset of 20 cases was selected for further analysis. Among these cases, some individuals had unfortunately passed away due to severe asthma, which was characterized by an increased presence of Th2-cells. Another separate subset comprised individuals with asthma in a moderate state, who had managed to overcome both COVID-19 and asthma with relatively few complications. These distinct subgroups were then compared to individuals who did not have asthma. This comparison included individuals who had died from COVID-19 as well as those who had successfully recovered from the disease. The experimental study was carried out to detect thousands of genes using microarray. Gene expression data from DNA microarray or other sources is the input. Key features include data pre-processing, data exploration, differential expression analysis, pathway analysis, and data visualization [14]. The information about the patients was retrieved and analyzed from the gene expression omnibus (GEO) with the ID (GSE178399) [15]. 20 patient profiles were chosen for the investigation, as shown in Table 1. The PCR tests for SARS-CoV-2 were positive for all patients. Patients were categorized into the following four groups: non-asthma patients survived, non-asthma patients deceased, asthma patients survived, and asthma patients deceased.
Table 1. Profiles of COVID-19 patients, 0 = Non-asthma, 1 = Asthma
Sample | Accession no. | Age | Asthma | Outcome |
1 | GSM5389989 | 41 | 0 | Survived |
2 | GSM5389990 | 38 | 0 | = |
3 | GSM5389991 | 39 | 0 | = |
4 | GSM5389992 | 63 | 0 | = |
5 | GSM5389993 | 25 | 0 | = |
6 | GSM5389998 | 59 | 0 | Deceased |
7 | GSM5380013 | 63 | 1 | Survived |
8 | GSM5380021 | 46 | 1 | = |
9 | GSM5380024 | 65 | 1 | = |
10 | GSM5380031 | 47 | 0 | Deceased |
11 | GSM5380032 | 46 | 0 | = |
12 | GSM5380049 | 82 | 1 | = |
13 | GSM5380054 | 87 | 1 | Survived |
14 | GSM5380059 | 57 | 1 | Deceased |
15 | GSM5380063 | 54 | 1 | Survived |
16 | GSM5380070 | 50 | 1 | Deceased |
17 | GSM5380077 | 78 | 0 | = |
18 | GSM5380083 | 66 | 0 | = |
19 | GSM5380127 | 49 | 1 | = |
20 | GSM5380273 | 58 | 1 | = |
GEO2R was used to evaluate and estimate the comparison between groups. GEO2R is used to identify genes that express differently under different experimental settings. The results are summarized in a table that lists the top 92 genes, sorted according to their P-value. These genes have significantly the lowest P-value.
Ten genes out of a total of 92 were selected to be tested for expression across 20 selected samples. The online STRING tool was used to measure the correlation between genes. The phylogenetic tree for genes was extracted using iTOL and STRING servers. The heat map of the expressed genes was extracted using iDEP.96.
Results
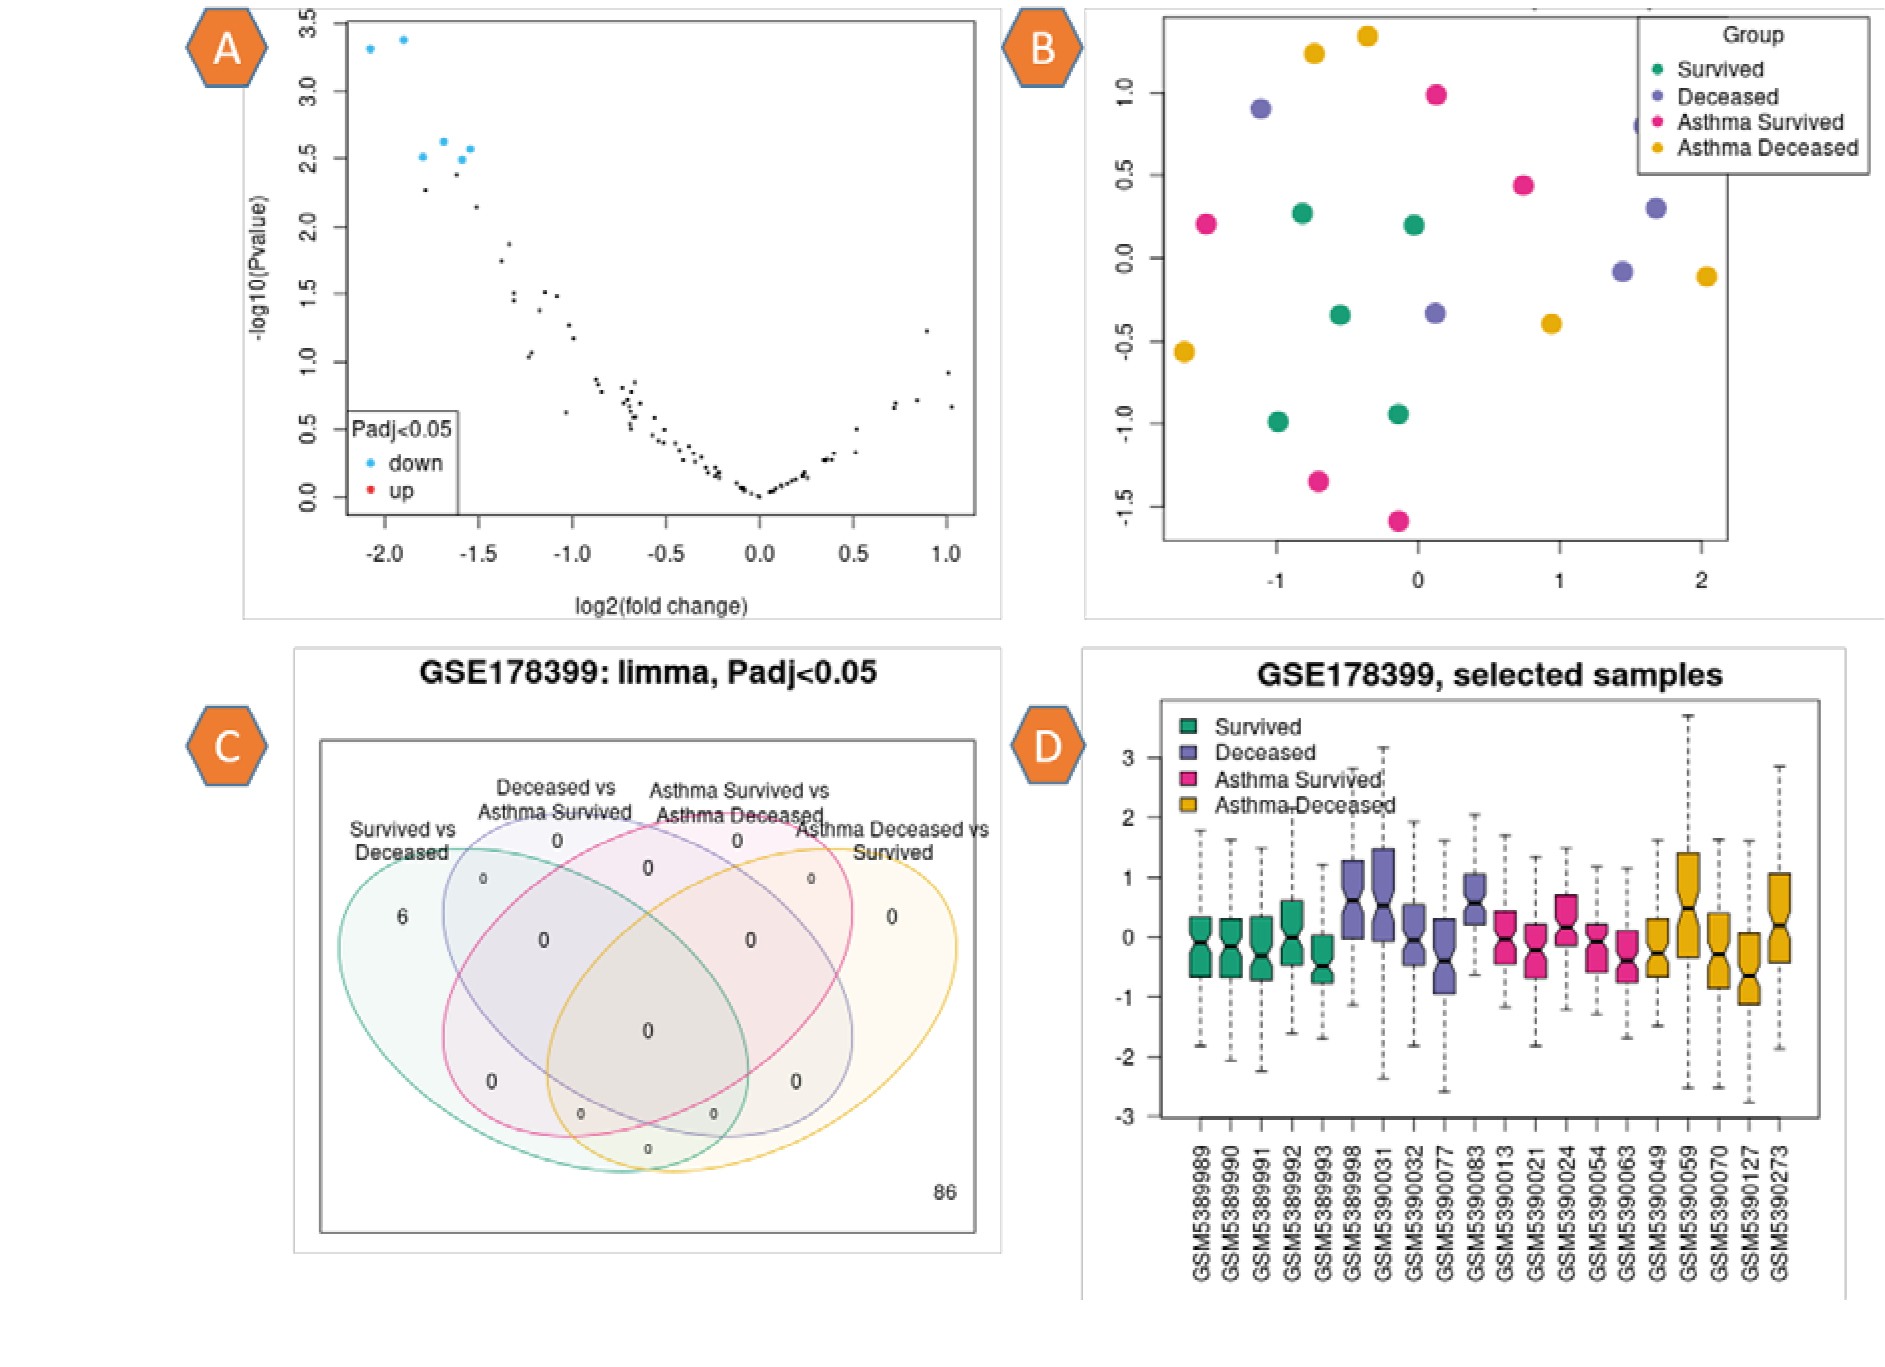
The information regarding the expression of 92 genes for 20 samples was supplied in the supplementary file. This information included the adj. P value, the P value, and the spot Id. A volcano graphic visualizes differentially expressed genes by displaying statistical significance with (–log10 P value) vs the amount of change (log2 fold change). Figure 1, a depicts normal expression as black dot genes and down-regulation as blue dot genes. Uniform Manifold Approximation and Projection (UMAP) is a technique for reducing the number of dimensions that is beneficial for visualizing how different samples are related to one another. Indicated within the plot is the total number of nearest neighbors that were factored into the calculation. The variance in gene expression was not significantly different across any of the patient groups (Fig. 1, b). The limma (Venn diagram) method is used to investigate and download the overlap in important genes between various comparisons. By selecting the relevant contrasts, the genes in each Venn diagram region can be downloaded. The study's findings show that no number of genes are linked to each other among the patient groups (Fig. 1, c). The box plot was used to disperse the values of the chosen samples. Colored samples were distributed in groups. The distribution's width can be utilized to determine whether the selected samples are suitable for differential expression analysis. The values of the patient samples centered on the median indicate that the data are standardized and mutually comparable, implying that all of the selected samples have an equal value distribution. The graphic depicts the data after log transformation and normalization, Fig. 1, d.

Fig. 1. a: Volcano plot: Prevalence of genes, black dots indicate normal gene expression, blue dots indicate down regulation. b: UMAP plot presents the distribution of sample related to their colors. c: Limma plot for the groups of patients represents without correlations between groups in P adj. value < 0.05. D: Box plot of the patients’ profile represents the standardized and mutually comparable.
plotDensities was utilized to estimate the distribution values of the selected samples based on the colored group. This plot complements the boxplot for data normalization verification before differential expression analysis. There is no difference in the distribution of density curves in the current investigation. The plot depicts the data after log transformation and normalization have been completed, as seen in Fig. 2, a. The limma (qqt) plot compares the quantiles of the dataset to the theoretical quantiles of the t-test distribution. This plot aids in evaluating the quality of the limma test results. The dots in Fig. 2, b are optimally aligned along a straight line, indicating that the values for the moderated t-statistic derived from the test conform to their theoretically predicted distribution. After a linear model has been fitted, the Vooma plot is used to assess the mean-variance relationship of expression data. This graphic can assist determine whether it is worthwhile to use precision weights to account for the trend of mean-variance. Each black dot in the data represents a gene, and the red line is an approximation of the variance direction that can be taken into account during differential gene expression analysis. The blue line depicts the continuous variation shown in the illustration in Fig. 2, c.

Fig. 2. a: plotDensities: Distribution of samples divided into four groups according to color. b: limma (qqt): Arrangement of dataset to the theoretical quantiles of the t-test distribution. c: Vooma plot: The mean correlation variance of the expression data.
The heatmap of the expression genes for the selected samples is shown in Fig. 3. Changes in gene expression are shown by a scale ranging from –3 for down-regulation (green) to 3 for up-regulation (red).

Fig. 3. Heatmap of the 20 samples gene expression. The scale of expression is between (–3 down-regulation to 3 up-regulation).
As a result of the variation in gene expression between samples, ten genes were chosen to investigate the variation in gene expression that exists between the four patient groups, as shown in Fig. 4. The expression of ten genes and their accession numbers are listed in Table 2.

Fig. 4. Expression levels of the ten profile genes studied are varied significantly between the four patient groups.
Table 2. Expression selected genes and their IDs
ID | Adj. P. Val | P. Value | Frequency | Common name of gene | Node degree | Expression |
P09238 | 0.0804 | 0.000874 | 7.0282 | MMP10 (Matrix metalloproteinase-10 ) | 2 | Down Regulation |
O00300 | 0.1472 | 0.003633 | 5.47 | TNFRSF11B (Tumor necrosis factor receptor superfamily member 11B) | 3 | Down-Regulation |
P55773 | 0.1472 | 0.005515 | 5.036 | CCL23 (C-C motif chemokine ligand 23) | 3 | Down-Regulation |
Q9NZQ7 | 0.1472 | 0.006401 | 4.8835 | CD274 (Programmed cell death 1) | 3 | Down-Regulation |
P78423 | 0.2214 | 0.016846 | 3.9207 | CX3CL1 (C-X3-C motif chemokine ) | 4 | Down-Regulation |
Q9P0M4 | 0.2462 | 0.024484 | 3.5608 | IL17C (Interleukin-17C) | 1 | Down-Regulation |
P03956 | 0.4652 | 0.157531 | 1.8485 | MMP1 (Matrix metalloproteinase-1 ) | 4 | Normal |
P22301 | 0.3639 | 0.090973 | 2.3426 | IL10 (Interleukin-10) | 9 | Normal |
Q07325 | 0.3014 | 0.066121 | 2.6331 | CXCL9 (C-X-C motif chemokine 9) | 5 | Normal |
Q16552 | 0.6217 | 0.405465 | 0.999 | IL17A (Interleukin-17A) | 6 | Normal |
According to the criterion of P < 0.05, ten genes (MMP10, TNFRSF11B, CCL23, CD274, CX3CL1, IL17C, MMP1, IL10, CXCL9, and IL17A) were identified as being associated with an increased risk and warranting further investigation. Heat maps illustrating the relationship between these shared genes based on sample expression revealed that a large proportion of the genes with down-regulated expression were shared (Fig. 5). The type and strength of the relationship between the 10 immune genes are depicted in Fig. 6, a. Seven of ten genes were shown to have a distinct cumulative association after clustering, as shown in Fig. 6, b. Proteins whose gene expression is associated across a wide range of tests. Figure 7 illustrates coexpression scores based on protein co-regulation and RNA expression patterns. Proteins that coexpress the 10 genes under study are associated in a way that is distinct from that seen in other organisms. Figure 8 depicts a phylogenetic tree of the 10 immune-correlated immune genes. Clade Coverage for collapsed groupings of genomes in the phylogenetic tree shows the lowest and highest similarity within that clade as two different hues. Each gene of interest has a color corresponding to the similarity of its best hit inside a specific STRING genome. Interactions can be predicted based on the correlations between these presence/absence profiles. Gene co-occurrence of the correlated gene families with comparable occurrence patterns across genomes is shown in Fig. 9.

Fig. 5. Heatmap of expression genes shows the correlation of high significant of down regulation.

Fig. 6. Multi-interactions views between nodes of immune genes. a — the pop-ups provide information regarding the nodes and edges between genes; b — 7 cluster genes appear in red color with high affinity and cluster with 2 genes in green.

Fig. 7. The correlation between coexpression genes with human pattern and some organisms.

Fig. 8. Phylogenetic tree of 10 genes. Each collection of genes is color-coordinated.

Fig. 9. Gene co-occurrence of gene families whose distribution patterns across genomes are comparable to one another.
Discussion
The purpose of this study is to investigate the pathogenetic processes and genetic pathways in COVID-19 patients with and without asthma issues from several biological viewpoints. Transcriptome data have recently been often employed in investigations relating to COVID-19 comorbidity.
Asthma is distinguished by the prolonged inflammation of air passages, leading to chest constriction, wheezing, and coughing. Individuals with persistent asthma have displayed notable decline in lung capacity and resistance to steroid treatments, underscoring the need for novel approaches in developing anti-inflammatory therapies [16].
After choosing 20 patients from this study, splitting them into four groups, and determining the gene expression levels of 92 genes, it was discovered that 6 immune genes out of the 92 had down-regulation of expression (MMP10, TNFRSF11B, CCL23, CD274, CX3CL1, and IL17C). The distribution of gene expression is balanced among the patients who were chosen. In the overall distribution, the number of linked genes was low, but compared to the quantiles, a mathematical increase with a significant theme was detected at P < 0.05. Then, a heatmap was used to quantify gene expression, and a stark contrast was seen between unregulated (red) and down-regulated (green).
Because of this discrepancy, 10 genes were selected, knowing that 6 of these genes were the weakest. The degree of the node varied among (1- 9) genes and this is what was observed in Table 2. In terms of both P and adj.P values, the six genes were the most prevalent.
Figure 4 depicts the expression of the ten immune proteins in patients, however, in general, the expression of the proteins is nearly the same in the coronavirus group. MMP10 expression was higher in the second and fourth groups, i.e., in deceased patients, indicating that this gene is not linked to asthma. The identical outcome was conducted for the proteins CX3CL1, IL17C, MMP1, and IL10. There is a clear increase in MMP1 expression in the first and second groups, but a decrease in expression in the third and fourth groups, indicating that this gene is directly associated with asthma disease. Even though the expression of IL17A protein was reduced in non-asthmatic patients, an increase in its expression was seen in asthmatic patients, particularly in survivors, indicating that this gene is intimately associated with asthma sensitivity. In contrast to the prior case, it was observed that non-asthmatic patients expressed CXCL9 at a much higher level than asthmatic patients. This result also suggests that this gene is associated with asthma, but in a reverse way.
The current study's findings demonstrate that the linked genes in COVID-19 individuals with asthma do not change significantly between the survivors and the deceased. In non-asthmatic patients, there is a clear and significant difference in most genes, where the expression was high in the deceased patients, except IL17A, where the expression was low in both survivors and dead individuals. The down-regulation of TP53BP1 (NK) was observed to inhibit the responses of Th17 cells and natural killer cells. Th17 cells primarily function through IL-17 to carry out their activities. Individuals with COVID-19 might exhibit increased levels of IL-17, indicating that focusing on this cytokine could potentially serve as a therapeutic approach to address this disease [17].
Protein-protein interactions (IPP), as illustrated in Figure 6, include gene neighborhood, gene co-occurrence, protein co-expression, text mining, and protein homology, depending on the quality of the binding between proteins. A cluster analysis of the proteomes revealed that two sets of three genes are associated in different ways: the first set of seven genes is shown in red, while the second set of two genes is shown in green according to the linking formula.
Since immune systems are found in so many different types of species, we needed to determine how the prevalence of these proteins in humans compares to that of other types of organisms. According to the degree of similarity scale, there is a clear similarity between the genes of various creatures.
In a cohort of patients admitted with COVID-19, we demonstrate that there is a substantial difference between the cytokine profiles of those who died and those who survived. Our results provide insight into how to best target COVID-19 therapy and prevention efforts for certain subsets of patients [18]. Furthermore, our findings propose a potential association among certain genes that were initially disregarded across all patients. It was observed that psoriasis patients exhibiting higher-than-average Th17 responses also displayed heightened severity of allergic asthma. Additionally, IL-17 was found to reduce the inhibition of ACE-2 expression, which is a receptor crucially involved in the cellular entry of SARS-CoV-2 [19–21].
A study of 220 asthmatic COVID-19 patients found that asthma was not linked to a higher risk of hospitalization after age, gender, and other diseases were taken into account [22]. The incidence of hospitalizations and fatalities attributable to COVID-19 was surprisingly low, even among patients with the most severe clinical symptoms, which was found in another study of asthmatics treated with biologicals.
It is crucial to establish a clear understanding of how SARS-CoV-2 infection progresses in individuals with asthma. This involves examining the impact of asthma itself, any related health conditions linked to asthma, and the treatments used for asthma, all of which may collectively influence the outcomes associated with COVID-19 [23].
While more research is required to determine the exact mechanisms underlying the altered clinical manifestations of COVID-19, our findings indicate a correlation between an imbalance in gene expression and mortality as compared to a surviving group. Clinical trials might present potential defenses against negative viral impacts [24].
Conclusions
Infection with the coronavirus has been linked to a variety of conditions that affect the immune system, including asthma. According to the findings of this study, there are immune genes whose expression can shift in a positive or negative direction depending on the nature of the patient, the type of infection, and whether or not the individual suffers from asthma. There is no correlation between the expression of MMP10 and asthma, although there is a significant correlation between the expression of MMP1 and sensitivity. Patients were found to have similar levels of expression for the proteins CX3CL1, IL17C, MMP1, and IL10. Patients showed identical expression of the proteins CX3CL1, IL17C, MMP1, and IL10. The expression of the IL17A protein is reduced in non-asthmatic patients but raised in asthmatic patients, particularly in survivors, which is closely associated with allergic asthma. In contrast, CXCL9 levels were much greater in non-asthmatic patients. This discovery also suggests that this gene is linked to asthma. The study found that the unbalanced gene expression was associated with mortality relative to the rest of the group. There is no substantial difference in gene expression in asthmatic patients who survive and those who deceased.
About the authors
Ali Adel Dawood
University of Mosul
Author for correspondence.
Email: aad@uomosul.edu.iq
ORCID iD: 0000-0001-8988-5957
Ph.D. Microbiology (Biology science), Dr. (Anatomy department), University of Mosul
Iraq, MosulReferences
- Deng Y., Liu W., Liu K., et al. Clinical characteristics of fatal and recovered cases of coronavirus disease 2019 (COVID-19) in Wuhan, China: a retrospective study. Chin. Med. J. (Engl.) 2020;133(11):1261–7. DOI: https://doi.org/10.1097/cm9.0000000000000824
- Давуд А.А., Ясим Б.И., Рияд-аль-Джалили О. Идентификация мутаций поверхностного гликопротеина SARS-CoV-2 в штаммах, изолированных в Ираке. Медицинская иммунология. 2022;24(4):729–40. Dawood A.A., Jasim B., Riadh Al-Jalily O. Identification of surface glycoprotein mutations of SARS-CoV-2 in isolated strains from Iraq. Medical Immunology (Russia). 2022;24(4):729–40. DOI: https://doi.org/10.15789/1563-0625-IOS-2455 EDN: https://elibrary.ru/bujrnm
- Izquierdo J.L., Almonacid C., González Y., et al. The impact of COVID-19 on patients with asthma. Eur. Respir. J. 2021;57(3):2003142. DOI: https://doi.org/10.1183/13993003.03142-2020
- Fergeson J.E., Patel S.S., Lockey R.F. Acute asthma, prognosis, and treatment. J. Allergy Clin. Immunol. 2017;139(2):438–47. DOI: https://doi.org/10.1016/j.jaci.2016.06.054
- Nashiry A., Sumi S.S., Islam S., et al. Bioinformatics and system biology approach to identify the influences of COVID-19 on cardiovascular and hypertensive comorbidities. Brief. Bioinform. 2021;22(2):1387–401. DOI: https://doi.org/10.1093/bib/bbaa426
- Herring C., Hernandez Y., Huffnagle B., Toews B. Role and development of TH1/TH2 immune responses in the lungs. Semin. Respir. Crit. Care Med. 2004;25(1):3–10. DOI: https://doi.org/10.1055/s-2004-822300
- Johnston S.L. Asthma and COVID-19: is asthma a risk factor for severe outcomes? Allergy. 2020;75(7):1543–5. DOI: https://doi.org/10.1111/all.14348
- Shen W.X., Luo R.C., Wang J.Q., Chen Z.S. Features of cytokine storm identified by distinguishing clinical manifestations in COVID-19. Front. Public Health. 2021;9:671788. DOI: https://doi.org/10.3389/fpubh.2021.671788
- Xia J., Chen S., Li Y., et al. Immune response is key to genetic mechanisms of SARS-CoV-2 infection with psychiatric disorders based on differential gene expression pattern analysis. Front. Immunol. 2022;13:798538. DOI: https://doi.org/10.3389/fimmu.2022.798538
- Давуд А.А. Влияние мутационных вариантов спайкового гликопротеина и РНК-зависимой рнк-полимеразы (nsp12) SARS-CoV-2 на участки стыковки с ремдесивиром. Медицинская иммунология. 2022;24(3):617–28. Dawood A.A. Influence of SARS-CoV-2 variants’ spike glycoprotein and RNA-dependent RNA polymerase (nsp12) mutations on remdesivir docking residues. Medical Immunology (Russia). 2022;24(3):617–28. DOI: https://doi.org/10.15789/1563-0625-IOS-2486 EDN: https://elibrary.ru/ygzrvf
- Schneider D., Hong J.Y., Bowman E.R., et al. Macrophage/epithelial Cell CCL2 contributes to rhinovirus-induced hyperresponsiveness and inflammation in a mouse model of allergic airways disease. Am. J. Physiol. Lung Cell. Mol. Physiol. 2013;304(3):L162–9. DOI: https://doi.org/10.1152/ajplung.00182.2012
- Hamming I., Timens W., Bulthuis M.L., et al. Tissue distribution of ACE2 protein, the functional receptor for SARS coronavirus. A first step in understanding SARS pathogenesis. J. Pathol. 2004;203(2):631–7. DOI: https://doi.org/10.1002/path.1570
- Dawood A.A., Altobje M., Alrassam Z. Molecular docking of SARS-CoV-2 nucleocapsid protein with angiotensin-converting enzyme II. Microbiological Journal. 2021;83(2):82–92. DOI: https://doi.org/10.15407/microbiolj83.02.08
- Ge X., Son W., Yao R. iDEP: an integrated web application for differential expression and pathway analysis of RNA-Seq data. BMC Bioinformatics. 2018;19(1):534. DOI: https://doi.org/10.1186/s12859-018-2486-6
- Pavel A.B., Glickman J.W., Michels J.R., et al. Th2/Th1 cytokine imbalance is associated with higher COVID-19 risk mortality. Front. Genet. 2021;12:706902. DOI: https://doi.org/10.3389/fgene.2021.706902
- Green H., Brightling E., Woltmann G., et al. Analysis of induced sputum in adults with asthma: identification of subgroup with isolated sputum neutrophilia and poor response to inhaled corticosteroids. Thorax. 2002;57(10):875–9. DOI: https://doi.org/10.1136/thorax.57.10.875
- Kuo S., Pavlidis S., Loza M., et al. T-helper cell type 2 (Th2) and non-Th2 molecular phenotypes of asthma using sputum transcriptomics in U-BIOPRED. Eur. Respir. J. 2017;49(2):1602135. DOI: https://doi.org/10.1183/13993003.02135-2016
- Wu D., Yang O. TH17 responses in cytokine storm of COVID-19: an emerging target of JAK2 inhibitor Fedratinib. J. Microbiol. Immunol. Infect. 2020;53(3):368–70. DOI: https://doi.org/10.1016/j.jmii.2020.03.005
- Krueger G., Wharton Jr., Schlitt T., et al. IL-17A inhibition by secukinumab induces early clinical, histopathologic, and molecular resolution of psoriasis. J. Allergy Clin. Immunol. 2019;144(3):750–63. DOI: https://doi.org/10.1016/j.jaci.2019.04.029
- Pavel B., Wu J., Renert-Yuval Y., et al. SARS-CoV-2 receptor ACE2 protein expression in serum is significantly associated with age. Allergy. 2021;76(3):875–8. DOI: https://doi.org/10.1111/all.14522
- Zhang H., Penninger M., Li Y., et al. Angiotensin-converting enzyme 2 (ACE2) as a SARS-CoV-2 receptor: molecular mechanisms and potential therapeutic target. Intensive Care Med. 2020;46(4):586–90. DOI: https://doi.org/10.1007/s00134-020-05985-9
- Gupta A., Bush A., Nagakumar P. Asthma in children during the COVID-19 pandemic: lessons from lockdown and future directions for management. Lancet Respir. Med. 2020;8(11):1070–1. DOI: https://doi.org/10.1016/S2213-2600(20)30278-2
- Garg S., Kim L., Whitaker M., et al. Hospitalization rates and characteristics of patients hospitalized with laboratory-confirmed coronavirus disease 2019 – COVID-NET, 14 States, March 1-30, 2020. MMWR Morb. Mortal. Wkly Rep. 2020;69(15):458–64. DOI: https://doi.org/10.15585/mmwr.mm6915e3
- Branco A., Sato N., Alberca W. The possible dual role of the ACE2 receptor in asthma and Coronavirus (SARS-CoV2) infection. Front. Cell. Infect. Microbiol. 2020;10:550571. DOI: https://doi.org/10.3389/fcimb.2020.550571
Supplementary files

