


«Объясняющие» модели заболеваемости клещевыми инфекциями (на примере Астраханской риккетсиозной и Крымской-Конго геморрагической лихорадок)
- Авторы: Дубянский В.М.1,2, Прислегина Д.А.1,2, Платонов А.Е.2
-
Учреждения:
- Ставропольский научно-исследовательский противочумный институт Роспотребнадзора
- Центральный научно-исследовательский институт эпидемиологии Роспотребнадзора
- Выпуск: Том 100, № 1 (2023)
- Страницы: 34-45
- Раздел: ОРИГИНАЛЬНЫЕ ИССЛЕДОВАНИЯ
- URL: https://microbiol.crie.ru/jour/article/view/5417
- DOI: https://doi.org/10.36233/0372-9311-344
- ID: 5417

Цитировать

Аннотация
Введение. Работа посвящена разработке методик для математического обоснования причин несоответствий фактических показателей заболеваемости Астраханской риккетсиозной (АРЛ) и Крымской-Конго геморрагической лихорадками (ККГЛ) результатам эпидемиологического прогноза, обусловленных опосредованным влиянием погодных условий текущего эпидемического сезона.
Цель исследования — разработать с использованием данных спутникового мониторинга (дистанционного зондирования Земли из космоса) «объясняющие» модели заболеваемости АРЛ и ККГЛ и представить результаты их апробации на примере Ставропольского края и Астраханской области.
Материалы и методы. Материалами послужили климатические данные, полученные из Института космических исследований РАН, а также эпидемиологические сведения по заболеваемости ККГЛ и АРЛ с 2005 по 2021 г. «Объясняющие» модели были разработаны на основе теоремы Байеса и последовательного статистического анализа Вальда. Все расчёты были выполнены в созданной авторами программе на основе «Microsoft Exсel 2010».
Результаты. Установлено, что наибольшее опосредованное влияние на развитие эпидемиологической ситуации по ККГЛ в Ставропольском крае оказывают нормализованный относительный вегетационный индекс и относительная влажность воздуха в июне–июле, в Астраханской области показатели максимальной, минимальной и средней температуры воздуха в октябре, а также минимальной температуры воздуха в июле. Уровень заболеваемости АРЛ зависит от опосредованного действия среднегодовой и максимальной среднегодовой температуры воздуха, максимальной температуры воздуха и нормализованного относительного вегетационного индекса в апреле–июле. Совпадение результатов «объясняющих» моделей с аналогичными данными расчётов «прогнозных» моделей составило 46,2–100%.
Обсуждение. Предлагаемые «объясняющие» модели наряду с определением уровня заболеваемости, который мог бы быть достигнут при наблюдаемых значениях климатических факторов нынешнего года, позволяют проводить косвенную проверку «прогнозных» моделей с выявлением причин несоответствия результатов.
Заключение. Апробация «объясняющих» моделей свидетельствует о перспективности и целесообразности продолжения исследования на примере других, высокоэндемичных по клещевым инфекциям субъектов.
Полный текст
Введение
Прогнозирование динамики и уровня заболеваемости клещевыми трансмиссивными инфекциями (КТИ) — важный компонент системы эпидемиологического надзора за этими опасными, широко распространёнными на территории Российской Федерации природно-очаговыми болезнями. Значительное число работ посвящено составлению эпидемиологического прогноза на примере таких нозологических форм КТИ, как клещевой вирусный энцефалит, Астраханская риккетсиозная лихорадка (АРЛ), клещевой боррелиоз и Крымская-Конго геморрагическая лихорадка (ККГЛ) [1–10].
Данные прогнозирования эпидемиологической ситуации учитываются при планировании профилактических (в том числе акарицидных) мероприятий, при этом точность прогноза в значительной мере определяет их не только научную, но и экономическую обоснованность, а также возможность применения дифференцированного подхода при разработке плана. В связи с этим в случае обнаружения значительных различий между прогнозируемыми и фактическими зарегистрированными показателями интенсивности проявлений эпидемического процесса закономерно возникает вопрос о необходимости выяснения природы выявленных несоответствий. Помимо недостатков работы применяемых методов, требующих их модернизации, причины могут быть обусловлены внешним опосредованным влиянием на активность членистоногих переносчиков возбудителей КТИ погодных условий текущего года, предугадать действие которых заранее при составлении краткосрочного (на предстоящий год), а тем более средне- и долгосрочного прогноза невозможно. Например, известно, что раннее или, наоборот, позднее начало эпидемического сезона определяется достижением дневной температуры воздуха весной +9ºС и ночной не ниже +2ºС, что является необходимыми условиями для активизации перезимовавших особей Hyalomma marginatum (основных переносчиков возбудителя ККГЛ) и их питания на сельскохозяйственных животных, а пик паразитирования обычно регистрируется при среднемесячной температуре воздуха +16,9ºС [11–13].
Выраженное опосредованное влияние наблюдаемых климатических факторов в течение года на динамику и уровень заболеваемости населения ККГЛ также подтверждается рядом зарубежных исследований. Так, в юго-восточном Иране с помощью логистической регрессии выявлена выраженная связь количества случаев ККГЛ с ежемесячной средней температурой воздуха (прямая — с лагом в 2 мес и обратная — в 5 мес), максимальной месячной относительной влажностью и накопленным количеством осадков с лагом в 2 и 5 мес соответственно [14]. В результате работы, выполненной на основе метода регрессионного анализа Пуассона с псевдо-R-квадратом Макфаддена, в восточном Иране обнаружена сильная корреляция числа больных со значениями максимальной температуры (предыдущего месяца) и относительной влажности воздуха (в течение предшествующего месяца и полугода) [15]. Также иранскими исследователями с использованием логистической регрессии установлено, что с увеличением максимальной температуры воздуха 3 предшествующих месяцев на 1ºС и относительной влажности 2 предыдущих месяцев на 1% риски возникновения случаев заболевания повышаются на 9 и 4% соответственно [16].
Результаты однофакторного дисперсионного анализа (ANOVA), проведённого в Болгарии, свидетельствуют о том, что увеличение средней температуры воздуха и нормализованного вегетационного индекса (Normalized Difference Vegetation Index, NDVI) на 1 приводит к росту интенсивности проявлений эпидемического процесса ККГЛ на 5,5% [17]. Вместе с тем отечественные исследования по проблеме разработки методик, выявляющих и объясняющих с использованием методов математической статистики причинно-следственные связи между результатами прогноза заболеваемости ККГЛ и АРЛ, фактическими данными и влиянием климатических факторов текущего года до настоящего времени широко не проводились.
Цель исследования — разработать «объясняющие» модели заболеваемости АРЛ и ККГЛ и представить результаты их апробации на примере Ставропольского края и Астраханской области.
Материалы и методы
Данная работа является закономерным продолжением ранее начатого исследования по созданию «прогнозных» моделей и носит комплексный характер. В качестве изучаемых нозологических форм были определены АРЛ и ККГЛ как наиболее актуальные для юга России КТИ. Выбор территорий — Ставропольского края и Астраханской области — был обусловлен наиболее высокой интенсивностью проявлений эпидемического процесса по этим инфекциям в данных субъектах.
В работе использованы эпидемиологические и статистические методы исследования. Ретроспективный эпидемиологический анализ был проведён на основе сведений баз данных1 по заболеваемости АРЛ и ККГЛ, разработанных в формате проекта РНФ (№ 19-75-20088). Относительные показатели заболеваемости ККГЛ и АРЛ (на 100 тыс. населения) по каждому административному району выбранных субъектов были рассчитаны на основе сведений Федеральной службы государственной статистики2 за каждый год исследуемого периода. В качестве гидрометеорологических данных («независимых переменных») были использованы числовые значения 13 климатических факторов, полученных с использованием спутников дистанционного зондирования Земли из космоса3 (за каждый месяц исследуемого периода и среднегодовых):
- температуры воздуха — средней, максимальной и минимальной (ºС);
- температуры почвы на глубине 10 и 40 см (ºС);
- влажности почвы на глубине 10 и 40 см (%);
- глубины снега (м);
- доли площади, покрытой снегом (%);
- давления (Па);
- относительной влажности воздуха (%);
- количества осадков (кг/м2);
- NDVI (отн. ед.).
Таким образом, всего в качестве исходных данных для последующего выбора из них наиболее важных («информативных») использовались 169 параметров.
«Объясняющие» модели были разработаны с использованием непараметрической статистики — теоремы Байеса и анализа Вальда, коэффициенты информативности факторов были определены по методу Кульбака [18–20]. Фактор рассматривали как информативный и использовали при проведении дальнейших расчётов в случае получения значения информативности > 0,5.
Вычисления коэффициентов информативности и прогностических коэффициентов проводили автоматически в разработанной ранее авторами (при построении «прогнозных» моделей) программе на основе «Microsoft Exсel 2010» [10, 21, 22].
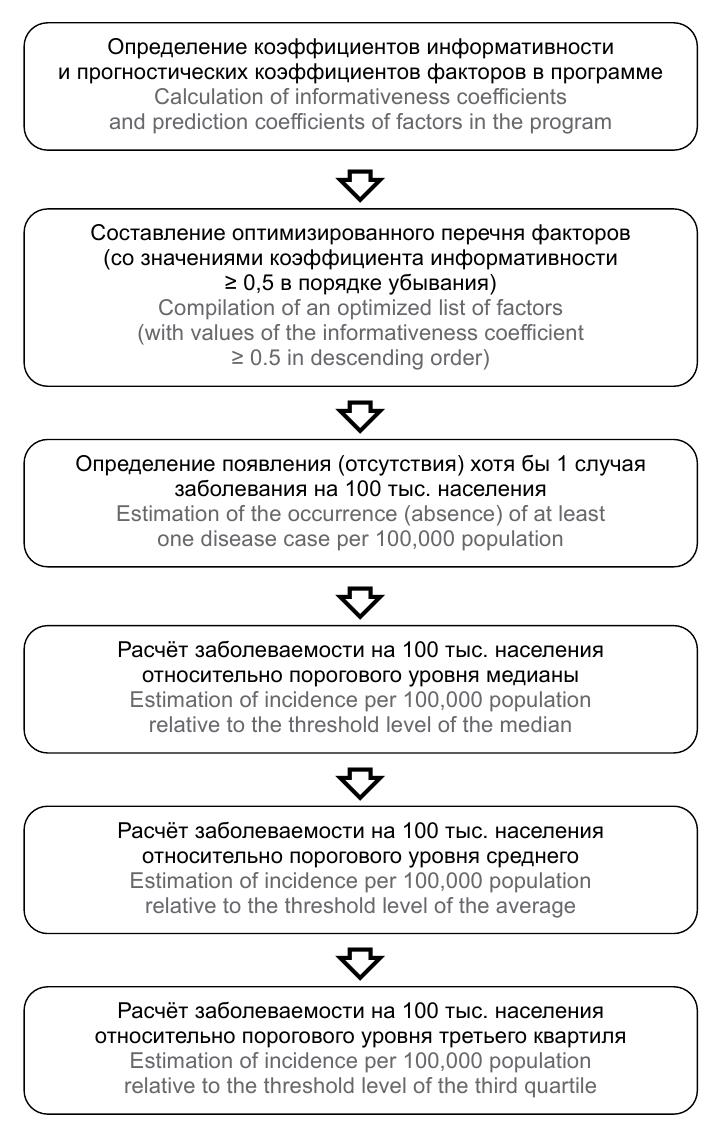
Математические расчёты в «объясняющих» моделях выполняли по аналогии с «прогнозными», показатели климатических факторов предыдущего года были заменены на числовые значения текущего эпидемического сезона [21]. Пошаговый алгоритм расчётов «объясняющих» моделей представлен на рисунке.

Алгоритм расчётов «объясняющих» моделей.
Algorithm for calculating explanatory models.
Пороговый уровень вероятности позитивного решения для «объясняющих» моделей динамики заболеваемости ККГЛ для Ставропольского края и Астраханской области был выбран 99,0% (вероятность ошибки составляла 1,0%). Для АРЛ на данном этапе исследования порог составил 90% (с вероятностью ошибки 10%), что связано с невысокой долей информативных параметров из используемого перечня. В дальнейшем при введении новых добавочных показателей (например, накопленных значений климатических данных) процент вероятности ошибки может быть снижен.
Итог — сумма прогностических коэффициентов информативных факторов в соответствии с градациями их значений по каждому административному району до получения числового значения «+20» или «–20» для моделей по ККГЛ и «+9» или «–9» для АРЛ, что свидетельствует о возникновении/отсутствии хотя бы 1 случая заболевания на 100 тыс. населения с вероятностью 99 и 90% соответственно. Далее для районов с положительными результатами работа аналогично проводилась относительно других выбранных пороговых уровней заболеваемости.
Значения медианы, среднего и третьего квартилей для моделей динамики заболеваемости ККГЛ для Ставропольского края составили 0,9, 3,5 и 4,7, для Астраханской области — 0,5, 1 и 2, для модели динамики заболеваемости АРЛ в Астраханской области — 25, 39,5 и 62,4 соответственно.
Расчёты по построению «объясняющих» моделей динамики заболеваемости ККГЛ на примере Ставропольского края были выполнены на основе ретроспективных сведений за 2005–2019 гг., ККГЛ и АРЛ на примере Астраханской области — за 2013–2019 гг.
«Пилотная» проверка работы моделей проводилась на ретроспективных сведениях 2018–2020 гг., апробация — на данных 2021 г.
Результаты и обсуждение
«Объясняющие» модели были созданы с целью решения следующих основных задач:
1) оценить опосредованную связь погодных условий текущего эпидемического сезона с интенсивностью проявлений эпидемического процесса ККГЛ и АРЛ с помощью расчёта коэффициентов информативности;
2) определить уровень заболеваемости, который мог бы быть достигнут при наблюдаемых значениях климатических факторов нынешнего года (без учёта влияния гидрометеорологических показателей предшествующего), с последующим сравнением с фактическими показателями;
3) провести косвенную проверку «прогнозных» моделей заболеваемости ККГЛ и АРЛ для выявления причин «ошибочных» результатов или, наоборот, подтверждения правильности их работы.
В ходе решения первой задачи установлено, что значимые климатические факторы для построения «объясняющих» моделей для разных субъектов существенно различались. Так, наиболее информативными факторами для Ставропольского края, согласно выполненным расчётам коэффициентов информативности, являлись NDVI и относительная влажность воздуха в июне–июле, что полностью соответствует данным литературы [23–27]. Для модели ККГЛ в Астраханской области наиболее высокие значения коэффициентов информативности были получены для максимальной, минимальной и средней температуры воздуха в октябре, а также минимальной температуры воздуха в июле, что также не противоречит данным публикаций о влиянии погодных условий на активность клещей [25–28]. Вместе с тем выявление подобных различий вполне закономерно и может быть объяснено значительным отличием ландшафтных, климатических, гидрологических и других условий Ставропольского края и Астраханской области, оказывающих значительное влияние на эпизоотолого-эпидемиологическую ситуацию по ККГЛ [29–31]. Наиболее высокоинформативными для «объясняющей» модели динамики заболеваемости АРЛ в Астраханской области были среднегодовая и максимальная среднегодовая температура воздуха, максимальная температура воздуха и NDVI в апреле–июле, что также согласуется с данными литературы [25, 28].
Проверка точности «объясняющих» моделей проводилась путём сопоставления данных расчётов с фактически зарегистрированными показателями заболеваемости по каждому административному району.
При этом варианты ошибочных прогнозов, полученные при построении модели, по аналогии с «прогнозными» моделями были разделены на 4 категории [21]:
- ложноположительный — результирующий итог «объясняющей» модели на первом этапе «положительный», но фактически ни одного случая заболевания не было выявлено;
- ложноотрицательный — на первом этапе расчётов получен результат «отрицательный», но фактически больные (хотя бы 1) были;
- завышенный — фактический показатель заболеваемости меньше значения, рассчитанного относительно порогового уровня;
- заниженный — фактический показатель заболеваемости превышает рассчитанный относительно порогового уровня результат.
Результаты проверки и апробации «объясняющих» моделей представлены в табл. 1–3.
Таблица 1. Результаты проверки за 2018–2020 гг. (ретроспективно) и апробации в 2021 г. «объясняющей» модели динамики заболеваемости ККГЛ (на примере Ставропольского края)
Table 1. Testing results for the explanatory model for CCHF incidence dynamics for 2018–2020 (retrospectively) and evaluation results in 2021 (the Stavropol Territory)
Результат Result | Годы | Years | |||||||
2018 | 2019 | 2020 | 2021 | |||||
число районов number of districts | % | число районов number of districts | % | число районов number of districts | % | число районов number of districts | % | |
Полностью совпадающий Correct | 10 | 38,5 | 13 | 50,0 | 8 | 30,8 | 16 | 61,5 |
Ложноположительный False positive | 8 | 30,8 | 7 | 26,9 | 13 | 50,0 | 5 | 19,2 |
Ложноотрицательный False negative | – | – | 2 | 7,7 | 1 | 3,8 | 2 | 7,7 |
Завышенный Overestimated | 8 | 30,8 | 4 | 15,4 | 4 | 15,4 | 3 | 11,5 |
Таблица 2. Результаты проверки за 2018–2020 гг. (ретроспективно) и апробации в 2021 г. «объясняющей» модели динамики заболеваемости ККГЛ (на примере Астраханской области)
Table 2. Testing results for the explanatory model for CCHF incidence dynamics for 2018–2020 (retrospectively) and evaluation results in 2021 (the Astrakhan Region)
Результат Result | Годы | Years | |||||||
2018 | 2019 | 2020 | 2021 | |||||
число районов number of districts | % | число районов number of districts | % | число районов number of districts | % | число районов number of districts | % | |
Полностью совпадающий Correct | 5 | 41,7 | 7 | 58,3 | 2 | 16,7 | 12 | 100,0 |
Ложноположительный False positive | 5 | 41,7 | 4 | 33,3 | 10 | 83,3 | – | – |
Ложноотрицательный False negative | – | – | – | – | – | – | – | – |
Завышенный Overestimated | 2 | 16,7 | 1 | 8,3 | – | – | – | – |
Таблица 3. Результаты проверки за 2018–2020 гг. (ретроспективно) и апробации в 2021 г. «объясняющей» модели динамики заболеваемости АРЛ (на примере Астраханской области)
Table 3. Testing results for the explanatory model for ARF incidence dynamics for 2018–2020 (retrospectively) and evaluation results in 2021 (the Astrakhan Region)
Результат Result | Годы | Years | |||||||
2018 | 2019 | 2020 | 2021 | |||||
число районов number of districts | % | число районов number of districts | % | число районов number of districts | % | число районов number of districts | % | |
Полностью совпадающий Correct | 9 | 75,0 | 8 | 66,7 | 3 | 25,0 | 6 | 50,0 |
Ложноположительный False positive | – | – | – | – | 4 | 33,3 | – | – |
Ложноотрицательный False negative | 1 | 8,3 | 1 | 8,3 | – | – | – | – |
Завышенный Overestimated | 2 | 16,7 | 3 | 25,0 | 5 | 41,7 | 6 | 50,0 |
Так, полное совпадение полученных результатов с фактическими данными для «объясняющих» моделей динамики заболеваемости ККГЛ для Ставропольского края составило от 30,8% (8 районов) в 2020 г. до 61,5% (16 районов) в 2021 г., для Астраханской области — от 16,7% (2 района) в 2020 г. до 100% (12 районов) в 2021 г. При проверке моделей для АРЛ доля совпадающих результатов находилась в пределах от 25% в 2020 г. (3 района) до 75% (9 районов) в 2018 г. Однако, если по аналогии с ранее разработанными «прогнозными» моделями (а также учитывая нижеприведённые объяснения о выраженном влиянии факторов предыдущего года на формирование популяций клещей текущего эпидемического сезона) «истинно» ошибочными результатами считать преимущественно «ложноотрицательные», то средняя точность моделей ККГЛ за исследуемый период для Ставропольского края и Астраханской области составит 95,2 и 100% соответственно, для модели АРЛ — 95,9%.
Полученные данные свидетельствуют о вполне удовлетворительной работе разработанных моделей и подтверждают правильность выбора метода для достижения поставленных в настоящем исследовании целей.
Однако особый интерес представляет одновременное сравнение результатов «объясняющих» моделей с «прогнозными» и фактическими данными, с помощью которого можно получить ответы сразу на несколько важных вопросов. Во-первых, в каждом случае «ошибочного» прогнозируемого и «верного» объясняющего результата можно выявить климатические факторы, действие которых, вероятнее всего, и не позволило «сбыться» прогнозу. Например, при оптимальных погодных условиях для формирования высокой численности популяций клещей предшествующего года неблагоприятные для активности переносчиков климатические факторы весенне-летнего периода текущего года (низкая температура в мае, затяжные дожди в июне–июле) косвенно способствовали более низкому уровню заболеваемости населения, совпадающему с фактически зарегистрированным. Или, наоборот, повышенная по сравнению с усреднённой нормой температура воздуха в апреле–мае могла способствовать более раннему началу эпидсезона, увеличению его длительности также способствует тёплая безветреная погода в сентябре. Именно из-за таких не поддающихся прогнозу погодных изменений наши прогнозные модели имеют рассчитанную ошибку 1 и 10% соответственно. Во-вторых, таким образом можно косвенно проверить работу «прогнозных» моделей. Например, одновременное получение «ложноположительных» или «завышенных» результатов в обеих моделях подтверждает правильность «прогнозной» модели и может свидетельствовать о неполном выявлении больных, обусловленном, к примеру, гиподиагностикой лёгких форм или являющимся отражением других внешних факторов, не связанных непосредственно с эпидемическим процессом КТИ, что будет более подробно рассмотрено ниже. В-третьих, одновременное получение «ложноотрицательных» результатов может свидетельствовать о заносном случае (когда больной заразился (отмечал укус клещом) во время пребывания на территории другого административного района или даже за пределами субъекта), или о подобных явлениях, действие которых в принципе невозможно учесть (к примеру, инфицирование произошло в результате ухода за заклещёванным скотом, пригнанным из другого района, высокоэндемичного по ККГЛ).
На ретроспективных данных 2018–2020 гг. установлено, что совпадение результатов «объясняющих» моделей динамики заболеваемости ККГЛ с аналогичными данными расчётов «прогнозных» для Ставропольского края составило от 46,2% в 2018 г. (12 районов) до 100% в 2019–2020 гг. (26 районов), для Астраханской области варьировало от их отсутствия в 2020 г. до 100% в 2019 г. (12 районов). При проверке моделей для АРЛ доля совпадающих результатов находилась в пределах от 66,7% в 2020 г. (8 районов) до 83,3% (10 районов) в 2019 г.
Результаты сопоставления на примере 2021 г. представлены в табл. 4–6.
Таблица 4. Сопоставление результатов «прогностической» и «объясняющей» моделей динамики заболеваемости ККГЛ для Ставропольского края (на примере 2021 г.)
Table 4. Comparison of results obtained by using prediction and explanatory models for CCHF incidence dynamics for the Stavropol Territory (for 2021)
Административный район Administrative district | Результат прогноза Prediction result | Трактовка прогноза Interpretation of prediction | Значение «объяснения» Interpretation of explanation | Результат «объяснения» Explanation result | Фактическая заболеваемость (на ١٠٠ тыс.) Actual incidence per 100,000 population) |
Александровский | Alexandrovsky | ≤ 0,000009 | Верный | Correct | ≤ 0,000009 | Верный | Correct | 0 |
Андроповский | Andropovsky | ≤ 0,000009 | Верный | Correct | ≤ 0,000009 | Верный | Correct | 0 |
Апанасенковский Apanasenkovsky | > 4,7 | Верный | Correct | > 4,7 | Верный | Correct | 10,1 |
Арзгирский | Arzgirsky | > 4,7 | Верный | Correct | > 4,7 | Верный | Correct | 8,3 |
Благодарненский | Blagodarnensky | > 4,7 | Верный | Correct | > 4,7 | Верный | Correct | 5,2 |
Буденновский | Budennovsky | > 4,7 | Ложноположительный False positive | > 4,7 | Ложноположительный False positive | 0 |
Георгиевский | Georgievsky | > 0,9 | Ложноположительный False positive | ≤ 0,000009 | Верный | Correct | 0 |
Грачевский | Grachevsky | ≤ 0,000009 | Ложноотрицательный False negative | ≤ 0,000009 | Ложноотрицательный False negative | 2,7 |
Изобильненский | Izobilnensky | > 4,7 | Ложноположительный False positive | ≤ 0,000009 | Верный | Correct | 0 |
Ипатовский | Ipatovsky | > 4,7 | Верный | Correct | > 4,7 | Верный | Correct | 5,4 |
Кировский | Kirovsky | ≤ 0,000009 | Верный | Correct | ≤ 0,000009 | Верный | Correct | 0 |
Кочубеевский | Kochubeevsky | ≤ 0,000009 | Верный | Correct | ≤ 0,000009 | Верный | Correct | 0 |
Красногвардейский Krasnogvardeisky | > 4,7 | Верный | Correct | > 4,7 | Верный | Correct | 5,4 |
Курский | Kursky | > 4,7 | Ложноположительный False positive | > 4,7 | Ложноположительный False positive | 0 |
Левокумский | Levokumsky | > 4,7 | Ложноположительный False positive | > 4,7 | Ложноположительный False positive | 0 |
Минераловодский Mineralovodsky | ≤ 0,000009 | Верный | Correct | ≤ 0,000009 | Верный | Correct | 0 |
Нефтекумский | Neftekumsky | > 4,7 | Завышенный Overestimated | > 4,7 | Завышенный Overestimated | 1,6 |
Новоалександровский Novoaleksandrovsky | > 4,7 | Ложноположительный False positive | ≤ 0,000009 | Верный | Correct | 0 |
Новоселицкий | Novoselytsky | > 4,7 | Ложноположительный False positive | ≤ 0,000009 | Верный | Correct | 0 |
Петровский | Petrovsky | > 4,7 | Завышенный Overestimated | > 4,7 | Завышенный Overestimated | 1,4 |
Предгорный | Predgornyy | ≤ 0,000009 | Верный | Correct | ≤ 0,000009 | Верный | Correct | 0 |
Советский | Soviet | > 4,7 | Ложноположительный False positive | ≤ 0,000009 | Верный | Correct | 0 |
Степновский | Stepnovsky | > 4,7 | Ложноположительный False positive | > 4,7 | Ложноположительный False positive | 0 |
Труновский | Trunovsky | > 4,7 | Завышенный Overestimated | > 4,7 | Завышенный Overestimated | 3,4 |
Туркменский | Turkmensky | > 4,7 | Ложноположительный False positive | > 4,7 | Ложноположительный False positive | 0 |
Шпаковский | Shpakovsky | ≤ 0,000009 | Ложноотрицательный False negative | ≤ 0,000009 | Ложноотрицательный False negative | 1,3 |
Таблица 5. Сопоставление результатов «прогностической» и «объясняющей» моделей динамики заболеваемости ККГЛ для Астраханской области (на примере 2021 г.)
Table 5. Comparison of results obtained by using prediction and explanatory models for CCHF incidence dynamics for the Astrakhan Region (for 2021)
Административный район Administrative region | Результат прогноза Forecast result | Трактовка прогноза Interpretation of forecast | Значение «объяснения» «Explanation» result | Результат «объяснения» Interpretation of «еxplanation» | Фактическая заболеваемость (на ١٠٠ тыс.) Actual morbidity (per 100,000 population) |
Астрахань | Astrakhan | > 2 | Ложноположительный False positive | ≤ 0,000009 | Верный | Correct | 0 |
Ахтубинский | Akhtubinsky | ≤ 0,000009 | Верный | Correct | ≤ 0,000009 | Верный | Correct | 0 |
Володарский | Volodarsky | > 2 | Ложноположительный False positive | ≤ 0,000009 | Верный | Correct | 0 |
Енотаевский | Enotaevsky | > 2 | Ложноположительный False positive | ≤ 0,000009 | Верный | Correct | 0 |
Икрянинский | Ikryaninsky | > 2 | Ложноположительный False positive | ≤ 0,000009 | Верный | Correct | 0 |
Камызякский | Kamyzyaksky | > 2 | Ложноположительный False positive | ≤ 0,000009 | Верный | Correct | 0 |
Красноярский | Krasnoyarsky | > 2 | Ложноположительный False positive | ≤ 0,000009 | Верный | Correct | 0 |
Лиманский | Limansky | > 2 | Ложноположительный False positive | ≤ 0,000009 | Верный | Correct | 0 |
Наримановский | Narimanovsky | > 2 | Ложноположительный False positive | ≤ 0,000009 | Верный | Correct | 0 |
Приволжский | Privolzhskiy | > 2 | Ложноположительный False positive | ≤ 0,000009 | Верный | Correct | 0 |
Харабалинский | Kharabalinsky | > 2 | Ложноположительный False positive | ≤ 0,000009 | Верный | Correct | 0 |
Черноярский | Chernoyarsky | ≤ 0,000009 | Верный | Correct | ≤ 0,000009 | Верный | Correct | 0 |
Таблица 6. Сопоставление результатов «прогностической» и «объясняющей» моделей динамики заболеваемости АРЛ для Астраханской области (на примере 2021 г.)
Table 6. Comparison of results obtained by using prediction and explanatory models for ARF incidence dynamics for the Astrakhan Region (for 2021)
Административный район Administrative region | Результат прогноза Forecast result | Трактовка прогноза Interpretation of forecast | Значение «объяснения» «Explanation» result | Результат «объяснения» Interpretation of «еxplanation» | Фактическая заболеваемость (на ١٠٠ тыс.) Actual morbidity (per 100,000 population) |
Астрахань | Astrakhan | ≤ 62,4 | Завышенный Overestimated | ≤ 39,5 | Завышенный Overestimated | 3,24 |
Ахтубинский | Akhtubinsky | > 62,4 | Ложноположительный False positive | ≤ 0,000009 | Верный Correct | 0,00 |
Володарский | Volodarsky | ≤39,5 | Завышенный Overestimated | ≤ 25 | Верный Correct | 2,18 |
Енотаевский | Enotaevsky | > 62,4 | Завышенный Overestimated | ≤ 25 | Верный Correct | 4,06 |
Икрянинский | Ikryaninsky | ≤ 62,4 | Завышенный Overestimated | ≤ 39,5 | Завышенный Overestimated | 15,24 |
Камызякский | Kamyzyaksky | ≤ 39,5 | Завышенный Overestimated | ≤ 25 | Верный Correct | 6,54 |
Красноярский | Krasnoyarsky | > 62,4 | Завышенный Overestimated | > 62,4 | Завышенный Overestimated | 32,82 |
Лиманский | Limansky | > 62,4 | Завышенный Overestimated | ≤ 39,5 | Завышенный Overestimated | 6,93 |
Наримановский | Narimanovsky | > 62,4 | Завышенный Overestimated | ≤ 39,5 | Завышенный Overestimated | 17,04 |
Приволжский | Privolzhskiy | ≤ 62,4 | Завышенный Overestimated | ≤ 39,5 | Верный Correct | 25,95 |
Харабалинский | Kharabalinsky | > 62,4 | Завышенный Overestimated | > 62,4 | Завышенный Overestimated | 46,09 |
Черноярский | Chernoyarsky | ≤ 25 | Ложноположительный False positive | ≤ 0,000009 | Верный Correct | 0,00 |
На примере представленных таблиц также видно, что предложенные нами модели наглядно объясняют закономерность отличия фактических и прогнозируемых показателей вследствие влияния условий текущего года. Так, по 5 административным районам Ставропольского края (Георгиевскому, Изобильненскому, Новоалександровскому, Новоселицкому и Советскому) с ложноположительными результатами прогноза в «объясняющей» модели было получено совпадение с фактическими данными (отсутствие больных ККГЛ), обусловленное в значительной мере неблагоприятными погодными условиями весенне-летнего периода. Для моделей по Астраханской области подобная ситуация для ККГЛ наблюдалась в 2 случаях — для Астрахани и Харабалинского района, для АРЛ — для 2 с ложноположительными (Ахтубинского и Черноярского) и 4 с завышенными (Володарского, Енотаевского, Камызякского и Приволжского) прогнозными показателями районов. Полученные результаты апробации, таким образом, свидетельствуют о возможности и целесообразности дальнейшего применения «объясняющих» моделей для решения всех поставленных перед их разработкой целевых задач.
Вместе с тем при анализе результатов работы моделей следует учитывать, что 2 года проверки и апробации (2020 г. и в некоторой степени 2021 г.) совпали с периодом пандемии COVID-19. Наблюдаемое в этот период снижение заболеваемости практически всеми формами КТИ, обусловленное как ограничительными мерами, так и сокращением числа специфических лабораторных исследований для верификации диагнозов и вероятной гиподиагностикой лёгких форм ККГЛ и АРЛ в связи с высокой загруженностью и перепрофилированием лечебно-профилактических организаций, вероятно, обусловили и минимальную точность показателей «объясняющих» моделей» для 2020 г. В пользу некоторого «внешнего» искажения работы моделей также свидетельствует высокий процент полученных одновременно «ложноположительных» («завышенных») результатов как для прогноза, так и для объяснения по одним и тем же районам — по ККГЛ для Ставропольского края (17 районов) и АРЛ для Астраханской области (7 районов). Поэтому полное представление об эффективности и точности моделей может быть получено после стабилизации эпидемиологической ситуации по COVID-19.
Заключение
Авторами впервые была предпринята попытка решить проблему комплексного взаимосвязанного и одновременно разнонаправленного влияния факторов предшествующего и текущего года на интенсивность проявлений эпидемического процесса по КТИ на юге России, а также получить математически обоснованный ответ на часто возникающий вопрос «Почему эпидемиологический прогноз не сбылся?». Итогом исследования стали разработанные на примере Ставропольского края и Астраханской области «объясняющие» модели динамики заболеваемости наиболее актуальными для Южного и Северо-Кавказского федерального округов КТИ — АРЛ и ККГЛ. Результаты, полученные при проверке и апробации моделей, — вполне удовлетворительные и свидетельствуют о возможности их использования как самостоятельно для характеристики влияния погодных условий текущего эпидемического сезона на эпидемиологическую ситуацию по КТИ, так и для проверки ранее созданных «прогнозных» моделей с последующим выяснением причин несоответствия рассчитанных прогнозных показателей заболеваемости фактически зарегистрированным.
Целесообразны дальнейшие проверки эффективности работы моделей, особенно в период стабилизации эпидемиологической ситуации по COVID-19, и совершенствование их работы с целью повышения точности получаемых результатов (поиск дополнительных информативных климатических и других факторов — например, накопленных значений температуры, выпавших осадков и т.д.). Кроме того, в качестве продолжения исследования планируется разработка подобных моделей для других, высокоэндемичных по КТИ, субъектов юга России (Ростовской и Волгоградской областей).
1 Сведения из карт эпидемиологического обследования очага инфекционного заболевания (форма № 357/у).
2 URL: https://rosstat.gov.ru; https://stavstat.gks.ru
3 ВЕГА-Science ЦКП «ИКИ-мониторинг». URL: http://sci-vega.ru/
Об авторах
Владимир Маркович Дубянский
Ставропольский научно-исследовательский противочумный институт Роспотребнадзора;Центральный научно-исследовательский институт эпидемиологии Роспотребнадзора
Email: daria775@rambler.ru
ORCID iD: 0000-0003-3817-2513
д.б.н., зав. отделом эпизоотологического мониторинга и прогнозирования, член временного научного коллектива по выполнению гранта РНФ
Россия, Ставрополь; МоскваДарья Александровна Прислегина
Ставропольский научно-исследовательский противочумный институт Роспотребнадзора;Центральный научно-исследовательский институт эпидемиологии Роспотребнадзора
Email: daria775@rambler.ru
ORCID iD: 0000-0002-9522-129X
к.м.н., с.н.с. лаб. эпидемиологии, член временного научного коллектива по выполнению гранта РНФ
Россия, Ставрополь; МоскваАлександр Евгеньевич Платонов
Центральный научно-исследовательский институт эпидемиологии Роспотребнадзора
Автор, ответственный за переписку.
Email: daria775@rambler.ru
ORCID iD: 0000-0001-7450-0081
д.б.н., проф., г.н.с. лаб. эпидемиологии природно-очаговых инфекций
Россия, МоскваСписок литературы
- Углева С.В., Акимкин В.Г., Понежева Ж.Б., Ахмерова Р.Р., Спиренкова А.Е., Черникова Ю.Ю. и др. Эпидемиологическая общность и различия актуальных для Астраханской области трансмиссивных инфекций. Эпидемиология и вакцинопрофилактика. 2021; 20(6): 63–71. https://doi.org/10.31631/2073304620212066371
- Ильин В.П., Андаев Е.И., Балахонов С.В., Пакскина Н.Д. Прогнозирование заболеваемости клещевым вирусным энцефалитом в Российской Федерации в 2014 г., основанное на многофакторных регрессионных моделях. Проблемы особо опасных инфекций. 2014; (2): 48–52. https://doi.org/10.21055/0370-1069-2014-2-48-52
- Бериков В.Б., Лбов Г.С., Полякова Г.Л., Бахвалова В.Н., Панов В.В., Щучинова Л.Д. и др. Анализ факторов, влияющих на заболеваемость клещевым энцефалитом, с использованием логико-вероятностных и корреляционно-регрессионных моделей. Эпидемиология и вакцинопрофилактика. 2011; (6): 25–34.
- Широкоступ С.В., Шевченко В.В., Лукьяненко Н.В. Результаты оценки влияния факторов риска на заболеваемость клещевым вирусным энцефалитом и иксодовым клещевым боррелиозом в сочетанных очагах данных инфекций в Алтайском крае. Медицинский альманах. 2014; (4): 67–70.
- Haemig P.D., Sjöstedt de Luna S., Grafström A., Lithner S., Lundkvist Å., Waldenström J., et al. Forecasting risk of tick-borne encephalitis (TBE): using data from wildlife and climate to predict next year’s number of human victims. Scand. J. Infect. Dis. 2011; (5): 366–72. https://doi.org/10.3109/00365548.2011.552072
- Mills J.N., Gage K.L., Khan A.S. Potential influence of climate change on vector-borne and zoonotic diseases: a review and proposed research plan. Environ. Health Perspect. 2010; (11): 1507–14. https://doi.org/10.1289/ehp.0901389
- Estrada-Peña A., Zatansever Z., Gargili A., Aktas M., Uzun R., Ergonul O., et al. Modeling the spatial distribution of Crimean-Congo hemorrhagic fever outbreaks in Turkey. Vector. Borne. Zoonotic. Dis. 2007; 7(4): 667–78. https://doi.org/10.1089/vbz.2007.0134
- Дубянский В.М., Прислегина Д.А., Куличенко А.Н. Риск-ориентированная модель прогнозирования эпидемиологической ситуации по Крымской геморрагической лихорадке (на примере Ставропольского края). Анализ риска здоровью. 2018; (1): 13–21. https://doi.org/10.21668/health.risk/2018.1.02
- Прислегина Д.А., Дубянский В.М., Малецкая О.В., Куличенко А.Н., Василенко Н.Ф., Манин Е.А. и др. Крымская геморрагическая лихорадка в Ставропольском крае: современные клинико-эпидемиологические аспекты и новый подход к прогнозированию заболеваемости. Инфекционные болезни: новости, мнения, обучение. 2018; 7(3): 49–56. https://doi.org/10.24411/2305-3496-2018-13007
- Прислегина Д.А., Малецкая О.В., Дубянский В.М., Платонов А.Е. Крымская геморрагическая лихорадка в Северо-Кавказском федеральном округе: обзор эпидемиологической ситуации и совершенствование методики прогнозирования заболеваемости. Инфекция и иммунитет. 2022; 12(2): 357–65. https://doi.org/10.15789/2220-7619-CHF-1827
- Тохов Ю.М., Дегтярев Д.Ю., Дубянский В.М. Иксодовые клещи (морфология, медицинское значение, регуляция численности). Ставрополь; 2015.
- Трухачев В.И., Тохов Ю.М., Луцук С.Н., Дылев А.А., Толоконников В.П., Дьяченко Ю.В. Распространение и экологическая характеристика иксодовых клещей рода Hyalomma в экосистемах Ставропольского края. Юг России: экология, развитие. 2016; 11(2): 59–69. https://doi.org/10.18470/1992-1098-2016-2-59-69
- Тохов Ю.М., Чумакова И.В., Луцук С.Н., Дьяченко Ю.В., Котенев Е.С., Зайцев А.А. Иксодовые клещи — резервуар возбудителей инфекционных и инвазионных болезней на территории Ставропольского края. Вестник ветеринарии. 2013; (2): 19–21.
- Ansari H., Shahbaz B., Izadi S., Zeinali M., Tabatabaee S.M., Mahmoodi M., et al. Crimean-Congo hemorrhagic fever and its relationship with climate factors in southeast Iran: a 13-year experience. J. Infect. Dev. Ctries. 2014; 8(6):749–57. https://doi.org/10.3855/jidc.4020
- Mostafavi E., Chinikar S., Bokaei S., Haghdoost A. Temporal modeling of Crimean-Congo hemorrhagic fever in eastern Iran. Int. J. Infect. Dis. 2013; 17(7): 524–28. https://doi.org/10.1016/j.ijid.2013.01.010
- Mostafavi E., Haghdoost A., Irani A.D., Bokaei S., Chinikar S. Temporal modeling of Crimean-Congo hemorrhagic fever in Iran. J. Med. Microbiol. Infec. Dis. 2014; 1(2): 1–7.
- Vescio F.M., Busani L., Mughini-Gras L., Khoury C., Avellis L., Taseva E., et al. Environmental correlates of Crimean-Congo haemorrhagic fever incidence in Bulgaria. BMC Public Health. 2012; 12: 1116. https://doi.org/10.1186/1471-2458-12-1116
- Гублер Е.В. Вычислительные методы анализа и распознавания патологических процессов. Ленинград: Медицина; 1978.
- Гублер Е.В., Генкин А.А. Применение непараметрических критериев статистики в медико-биологических исследованиях. Ленинград: Медицина; 1973.
- Дубянский М.А., Кенжебаев А., Степанов В.М., Асенов Г.А., Дубянская Л.Д. Прогнозирование эпизоотической активности чумы в Приаралье и Кызылкумах. Нукус: Каракалпакстан; 1992.
- Дубянский В.М., Прислегина Д.А., Платонов А.Е. Прогнозирование заболеваемости Крымской геморрагической лихорадкой на основе данных спутникового мониторинга (дистанционного зондирования Земли из космоса) на примере Ставропольского края. Журнал микробиологии, эпидемиологии и иммунобиологии. 2022; 99(3): 322–35. https://doi.org/10.36233/0372-9311-213
- Прислегина Д.А., Дубянский В.М., Куличенко А.Н. Особо опасные арбовирусные лихорадки на юге России: совершенствование мониторинга с применением современных информационных технологий. Медицина труда и экология человека. 2019; (4): 50–8. https://doi.org/10.24411/2411-3794-2019-10047
- Котти Б.К., Заикина И.Н., Жильцова М.В. Распространение иксодового клеща Hyalomma marginatum Koch (Acari: Ixodidae) в Ставропольском крае. Наука. Инновации. Технологии. 2017; (3): 161–74.
- Тохов Ю.М. Иксодовые клещи Ставропольского края и их эпидемиологическое значение. Ставрополь; 2008.
- Балашов Ю.С. Иксодовые клещи — паразиты и переносчики инфекций. СПб.: Наука; 1998.
- Кошкина Н.А., Горячая Е.В. Морфобиологическая характеристика клеща Hyalomma marginatum marginatum и меры борьбы с ним. Российский паразитологический журнал. 2013; (2): 10–4.
- Nili S., Khanjani N., Jahani Y., Bakhtiari B. The effect of climate variables on the incidence of Crimean Congo Hemorrhagic Fever (CCHF) in Zahedan, Iran. BMC Public Health. 2020; 20(1): 1893. https://doi.org/10.1186/s12889-020-09989-4
- Зимина Ю.В., Куликова Л.Н., Салько В.Н., Ковтунов А.И. Иксодовые клещи Астраханской области, их роль в формировании природных очагов и передачи арбовирусов человеку. В кн.: Вопросы риккетсиологии и вирусологии. Астрахань–М.; 1996: 58–62.
- Шуваев Н.С., Бармин А.Н., Колчин Е.А., Бармина Е.А., Колчина Л.В. Конфликты в природопользовании Астраханской области как источник угрозы и риска нарушения устойчивого развития региона. Географический вестник. 2012; (4): 21–8.
- Федеральная служба геодезии и картографии России. Атлас Астраханской области. М.; 1997.
- Шальнев В.А. Ландшафты Ставропольского края. Ставрополь; 1995.
Дополнительные файлы

